File:Anscombe's quartet 3.svg

此SVG文件的PNG预览的大小:800 × 582像素。 其他分辨率:320 × 233像素 | 640 × 465像素 | 1,024 × 745像素 | 1,280 × 931像素 | 2,560 × 1,862像素 | 990 × 720像素。
原始文件 (SVG文件,尺寸为990 × 720像素,文件大小:59 KB)
| 描述 |
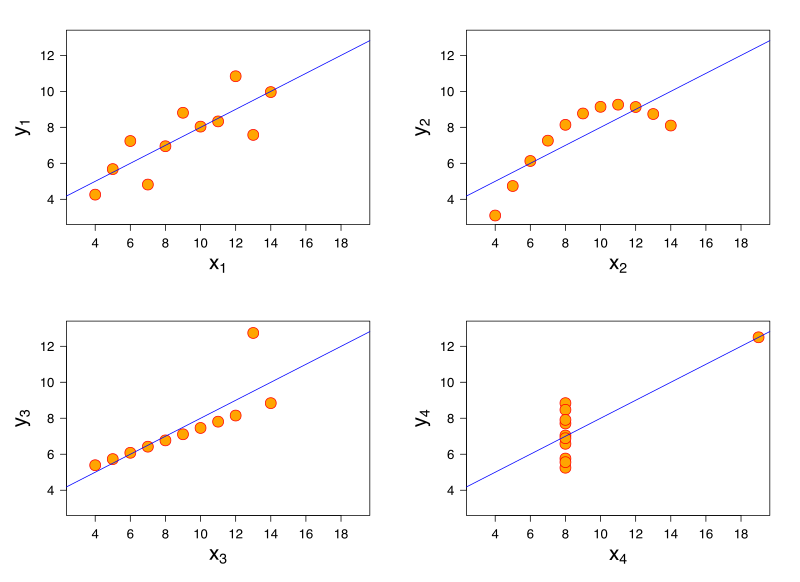
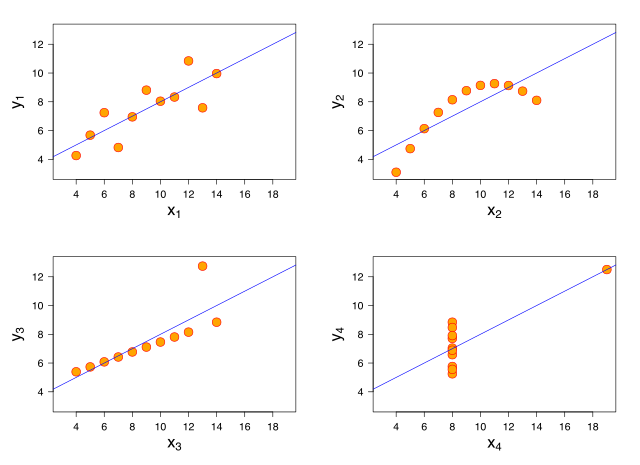
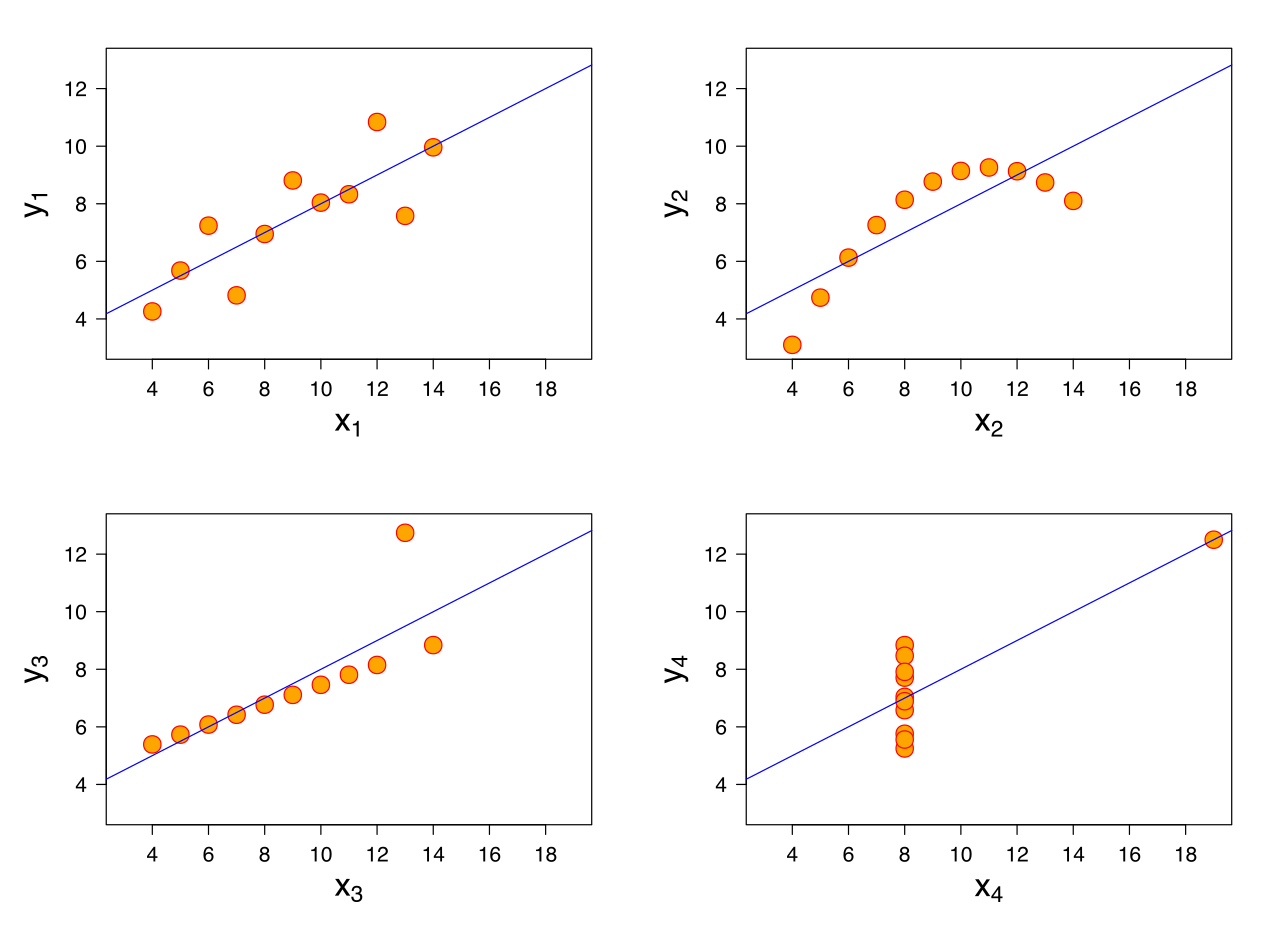
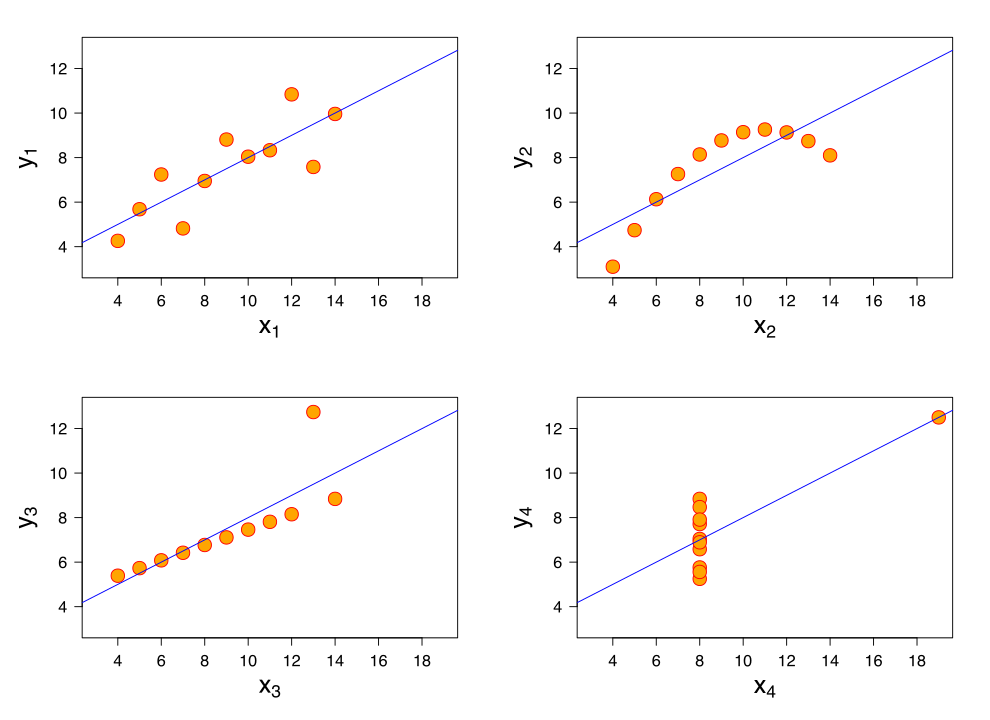
This graphic represents the four datasets defined by Francis Anscombe for which some of the usual statistical properties (mean, variance, correlation and regression line) are the same, even though the datasets are different. Reference:
|
| 日期 | (UTC) |
| 来源 | Anscombe.svg |
| 作者 |
|
| SVG开发 | This graphic is derived from earlier work by Schutz and the R development core team. As far as their rights and licensing allow, I license my contribution under the all the following licenses. The GPL is the only one I am sure applies.
|
| 源代码 | R codeR code to create the graphic:
svg("Anscombe's quartet 3.svg", width=11, height=8)
op <- par(las=1, mfrow=c(2,2), mar=1.5+c(4,4,1,1), oma=c(0,0,0,0),
lab=c(6,6,7), cex.lab=2.0, cex.axis=1.3, mgp=c(3,1,0))
ff <- y ~ x
for(i in 1:4) {
ff[[2]] <- as.name(paste("y", i, sep=""))
ff[[3]] <- as.name(paste("x", i, sep=""))
lmi <- lm(ff, data= anscombe)
xl <- substitute(expression(x[i]), list(i=i))
yl <- substitute(expression(y[i]), list(i=i))
plot(ff, data=anscombe, col="red", pch=21, cex=2.4, bg = "orange",
xlim=c(3,19), ylim=c(3,13)
, xlab=eval(xl), ylab=yl # for version 3
)
abline(lmi, col="blue")
}
par(op)
dev.off()
|
我,本作品著作权人,特此采用以下许可协议发表本作品:

|
本作品为自由软件,您可以依据自由软件基金会发行的GNU通用公共许可证第2版或任意后续版本的条款,传播和/或修改本作品。本作品发表时预期有用,但对此无任何保证,亦无隐含的可以销售或适合特定目的的保证。详情请见GNU通用公共许可证第2版和第3版。 |
本文件采用知识共享署名-相同方式共享 3.0 未本地化版本许可协议授权。
- 您可以自由地:
- 共享 – 复制、发行并传播本作品
- 修改 – 改编作品
- 惟须遵守下列条件:
- 署名 – 您必须对作品进行署名,提供授权条款的链接,并说明是否对原始内容进行了更改。您可以用任何合理的方式来署名,但不得以任何方式表明许可人认可您或您的使用。
- 相同方式共享 – 如果您再混合、转换或者基于本作品进行创作,您必须以与原先许可协议相同或相兼容的许可协议分发您贡献的作品。
|
|
已授权您依据自由软件基金会发行的无固定段落及封面封底文字(Invariant Sections, Front-Cover Texts, and Back-Cover Texts)的GNU自由文件许可协议1.2版或任意后续版本的条款,复制、传播和/或修改本文件。该协议的副本请见“GNU Free Documentation License”。 |
您可以选择您需要的许可协议。
原始上传日志
This image is a derivative work of the following images:
- File:Anscombe.svg licensed with GPL
Uploaded with derivativeFX
文件历史
点击某个日期/时间查看对应时刻的文件。
| 日期/时间 | 缩略图 | 大小 | 用户 | 备注 | |
|---|---|---|---|---|---|
| 当前 | 2010年3月26日 (五) 17:18 | | 990 × 720(59 KB) | Avenue | Increase size of axis titles |
| 2010年3月26日 (五) 17:09 |  | 990 × 720(59 KB) | Avenue | {{Information |Description=This graphic represents the four datasets defined by Francis Anscombe for which some of the usual statistical properties (mean, variance, correlation and regression line) are the same, even though the datasets are different. |So |
文件用途
以下页面使用本文件:
全域文件用途
以下其他wiki使用此文件:
- ar.wikipedia.org上的用途
- ca.wikibooks.org上的用途
- cs.wikipedia.org上的用途
- cy.wikipedia.org上的用途
- de.wikipedia.org上的用途
- el.wikipedia.org上的用途
- en.wikipedia.org上的用途
- Correlation
- Anscombe's quartet
- Talk:Anscombe's quartet
- Frank Anscombe
- Wikipedia:WikiProject Statistics
- User talk:Schutz
- Wikipedia:Featured pictures thumbs/21
- Wikipedia:WikiProject Mathematics/Recognized content
- Wikipedia:Featured picture candidates/Anscombe's quartet
- Wikipedia:Wikipedia Signpost/2010-04-05/Features and admins
- Wikipedia:Featured picture candidates/April-2010
- Wikipedia:Featured pictures/Sciences/Mathematics
- User talk:Avenue/Archive5
- Wikipedia:Picture of the day/December 2011
- Template:POTD/2011-12-11
- Wikipedia:Main Page history/2011 December 11
- Wikipedia:Help desk/Archives/2011 December 11
- User:Kazkaskazkasako/Books/Mathematics
- User talk:Avenue/Archive2011
- Wikipedia:WikiProject Statistics/Featured content
- Influential observation
- Portal:Mathematics/Selected picture
- Wikipedia:Wikipedia Signpost/Single/2010-04-05
- Linear regression
- Wikipedia:Reference desk/Archives/Mathematics/2016 February 21
- User:Ajmehta21/sandbox
- Portal:Mathematics/Selected picture/24
- Portal:Mathematics/Recognized content
- en.wikiversity.org上的用途
- eo.wikipedia.org上的用途
- et.wikipedia.org上的用途
- fa.wikipedia.org上的用途
- hy.wikipedia.org上的用途
- incubator.wikimedia.org上的用途
- it.wikipedia.org上的用途
- ja.wikipedia.org上的用途
查看本文件的更多全域用途。