File:Random Walk example.svg

此SVG文件的PNG预览的大小:720 × 540像素。 其他分辨率:320 × 240像素 | 640 × 480像素 | 1,024 × 768像素 | 1,280 × 960像素 | 2,560 × 1,920像素。
原始文件 (SVG文件,尺寸为720 × 540像素,文件大小:30 KB)
摘要
This file was copied from en.wikipedia by Toobaz, what follows is its original description:
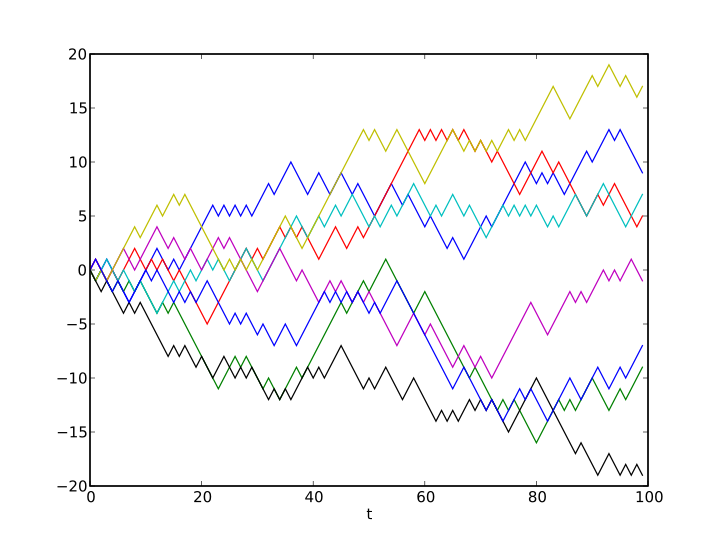
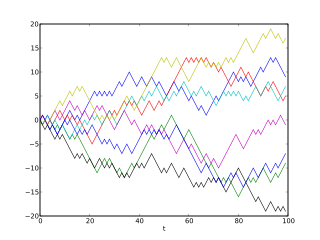
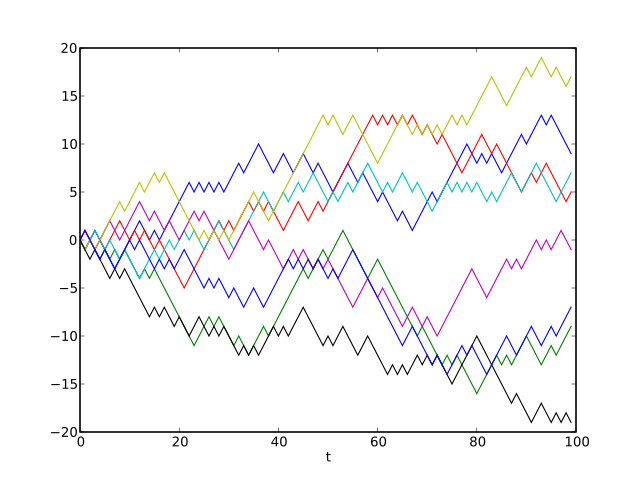
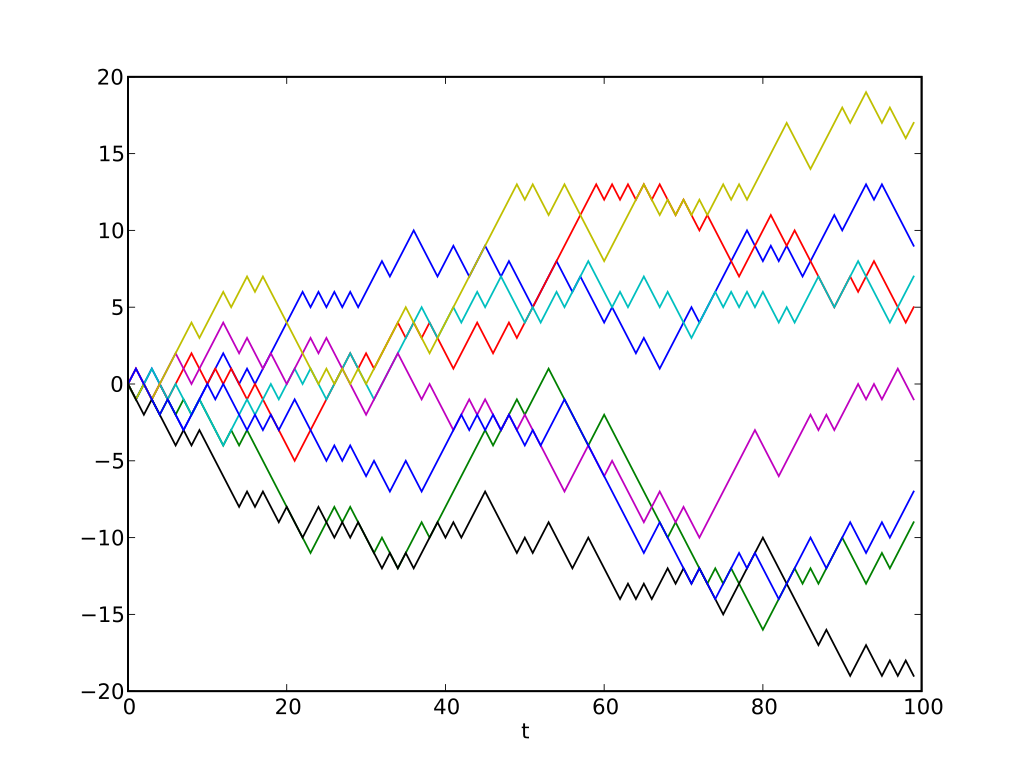
| 描述 | Eight different random walks. |
| 日期 | |
| 来源 |
I created this work entirely by myself. 本W3C状态不明的矢量图使用Matplotlib创作. |
| 作者 | Morn (talk) |
| 其他版本 | File:Random_Walk_example.png |
Code
Made with the following Python script (needs Matplotlib):
from pylab import *
from random import choice
numwalk = 8
length = 100
data = zeros((numwalk, length), int)
for n in range(numwalk):
	for x in range(1, length):
		step = choice([-1, 1])
		data[n,x] = data[n,x-1] + step
	plot(range(length), data[n,:])
xlabel('t')
axis ((0,100, -20, 20))
savefig('Random_Walk_example.svg')
show()

|
已授权您依据自由软件基金会发行的无固定段落及封面封底文字(Invariant Sections, Front-Cover Texts, and Back-Cover Texts)的GNU自由文件许可协议1.2版或任意后续版本的条款,复制、传播和/或修改本文件。该协议的副本请见“GNU Free Documentation License”。 |
原始上传日志
原始描述頁面位於這裡。下列使用者名稱均來自en.wikipedia。
- 2008-10-14 18:20 Morn 720×540× (30897 bytes) {{Information |Description= |Source=I created this work entirely by myself. |Date=2008-10-14 |Author=~~~ |other_versions= }} Made with the following Python script: <code> from pylab import * from random import choice numwalk = 8 length = 100 data = z
The following is the similar code in MATLAB and Octave
function RandomWalk () hold off; x = 1:100; color = ['y' 'g' 'b' 'k' 'r', 'm' 'c']; y(1)= 0; for m = 1:7 for n = 2:100 y(n) = y(n-1) + 2*floor(rand()*2)-1; end plot(x, y, color(m), 'LineWidth',2); hold on axis([0 100, -20 20]) end end
文件历史
点击某个日期/时间查看对应时刻的文件。
| 日期/时间 | 缩略图 | 大小 | 用户 | 备注 | |
|---|---|---|---|---|---|
| 当前 | 2010年2月5日 (五) 07:28 | | 720 × 540(30 KB) | Toobaz | == Summary == This file was copied from en.wikipedia by Toobaz, what follows is its original description: {{Information |Description=Eight different random walks. |Source=I created this work entirely by myself. |Date=2008-10-14 |Au |
文件用途
以下页面使用本文件:
全域文件用途
以下其他wiki使用此文件:
- ar.wikipedia.org上的用途
- bg.wikipedia.org上的用途
- cs.wikipedia.org上的用途
- de.wikipedia.org上的用途
- en.wikipedia.org上的用途
- eu.wikipedia.org上的用途
- fa.wikipedia.org上的用途
- he.wikipedia.org上的用途
- id.wikipedia.org上的用途
- it.wikipedia.org上的用途
- ms.wikipedia.org上的用途
- ps.wikipedia.org上的用途
- pt.wikipedia.org上的用途
- simple.wikipedia.org上的用途
- sr.wikipedia.org上的用途
- tr.wikipedia.org上的用途
- zh-yue.wikipedia.org上的用途