File:World map of prison population rates from World Prison Brief.svg

此SVG文件的PNG预览的大小:800 × 565像素。 其他分辨率:320 × 226像素 | 640 × 452像素 | 1,024 × 723像素 | 1,280 × 904像素 | 2,560 × 1,807像素。
原始文件 (SVG文件,尺寸为850 × 600像素,文件大小:164 KB)
摘要
| 描述 |
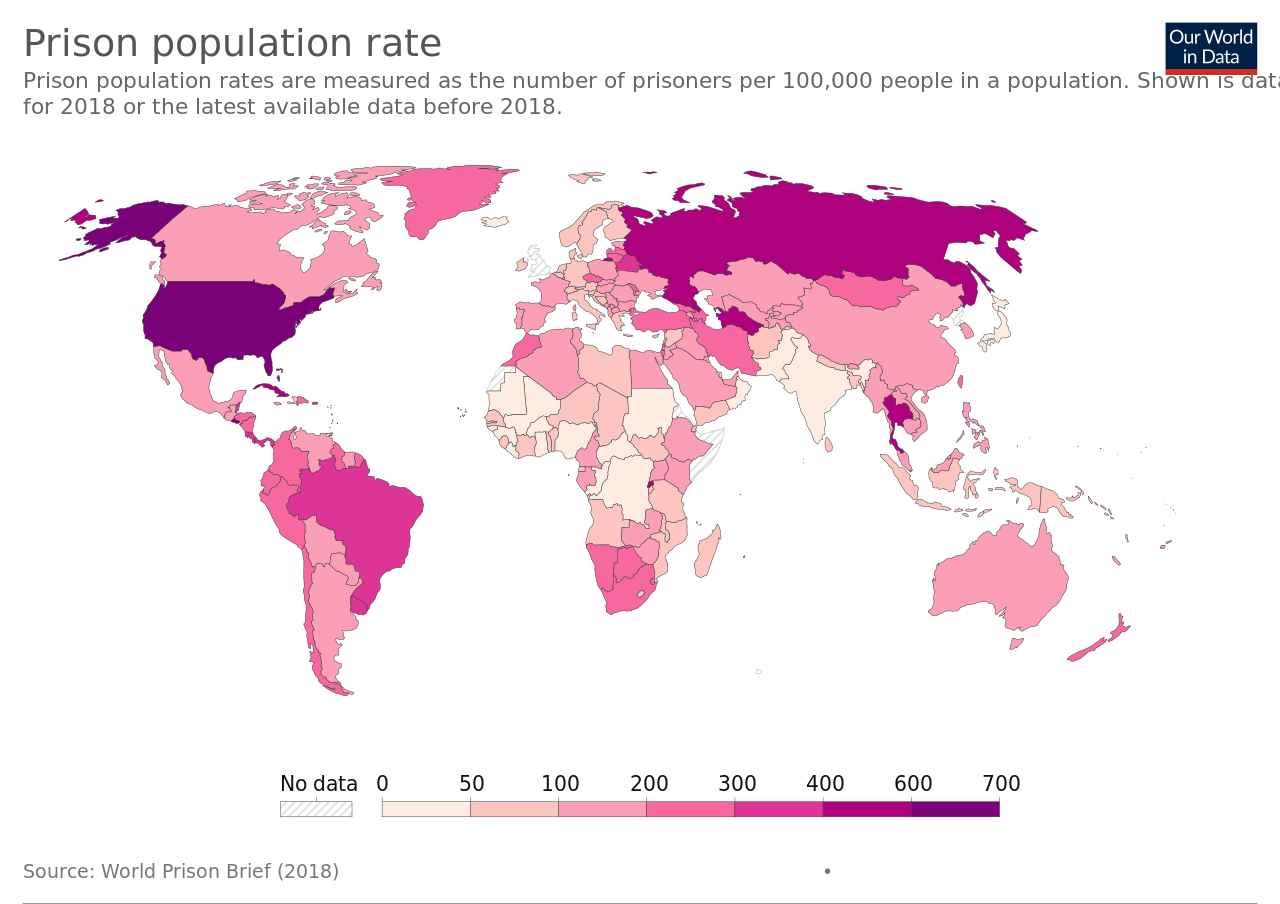
English: World map of prison population rates from World Prison Brief. See the date on the map. Rate is per 100,000 of national population. For the exact numbers click on the source link below and then go to the table tab. See also: List of countries by incarceration rate. |
| 日期 | is the date of the first upload to the Commons. See the file history below for the most recent upload date. |
| 来源 | https://ourworldindata.org/grapher/prison-population-rate - Click on the download tab to download map. The table tab has a table of the exact data by country. The map at the source is interactive and provides much more detail. For example, run your cursor over the color bar legend to see the countries that apply to that point in the legend. |
| 作者 | Our World In Data. See English Wikipedia: Our World in Data. |
| SVG开发 |
许可协议
文件历史
点击某个日期/时间查看对应时刻的文件。
| 日期/时间 | 缩略图 | 大小 | 用户 | 备注 | |
|---|---|---|---|---|---|
| 当前 | 2023年7月27日 (四) 10:14 | | 850 × 600(164 KB) | Timeshifter | Map has been slightly updated |
| 2022年8月2日 (二) 20:09 |  | 850 × 600(151 KB) | Andrew Pertsev | Fix svg errors | |
| 2021年5月15日 (六) 19:20 |  | 850 × 600(168 KB) | Timeshifter | Uploaded a work by Our World in Data from https://ourworldindata.org/grapher/prison-population-rate with UploadWizard |
文件用途
全域文件用途
以下其他wiki使用此文件:
- ar.wikipedia.org上的用途
- bg.wikipedia.org上的用途
- de.wikipedia.org上的用途
- en.wikipedia.org上的用途
- Human rights in Uzbekistan
- Incarceration in the United States
- Prison
- List of countries by incarceration rate
- Prisons in Turkey
- Federal Penitentiary Service
- Prisons in Russia
- Comparison of United States incarceration rate with other countries
- Department of Corrections (Thailand)
- Judicial system of the Islamic Republic of Iran
- en.wikibooks.org上的用途
- es.wikipedia.org上的用途
- fa.wikipedia.org上的用途
- fr.wikipedia.org上的用途
- hi.wikipedia.org上的用途
- ja.wikipedia.org上的用途
- ka.wikipedia.org上的用途
- ru.wikipedia.org上的用途
- simple.wikipedia.org上的用途
- sr.wikipedia.org上的用途