File:Interferenz.jpg
預覽大小:600 × 600 像素。 其他解析度:240 × 240 像素 | 480 × 480 像素 | 768 × 768 像素 | 1,024 × 1,024 像素 | 2,000 × 2,000 像素。
原始檔案 (2,000 × 2,000 像素,檔案大小:634 KB,MIME 類型:image/jpeg)
摘要
| 描述 |
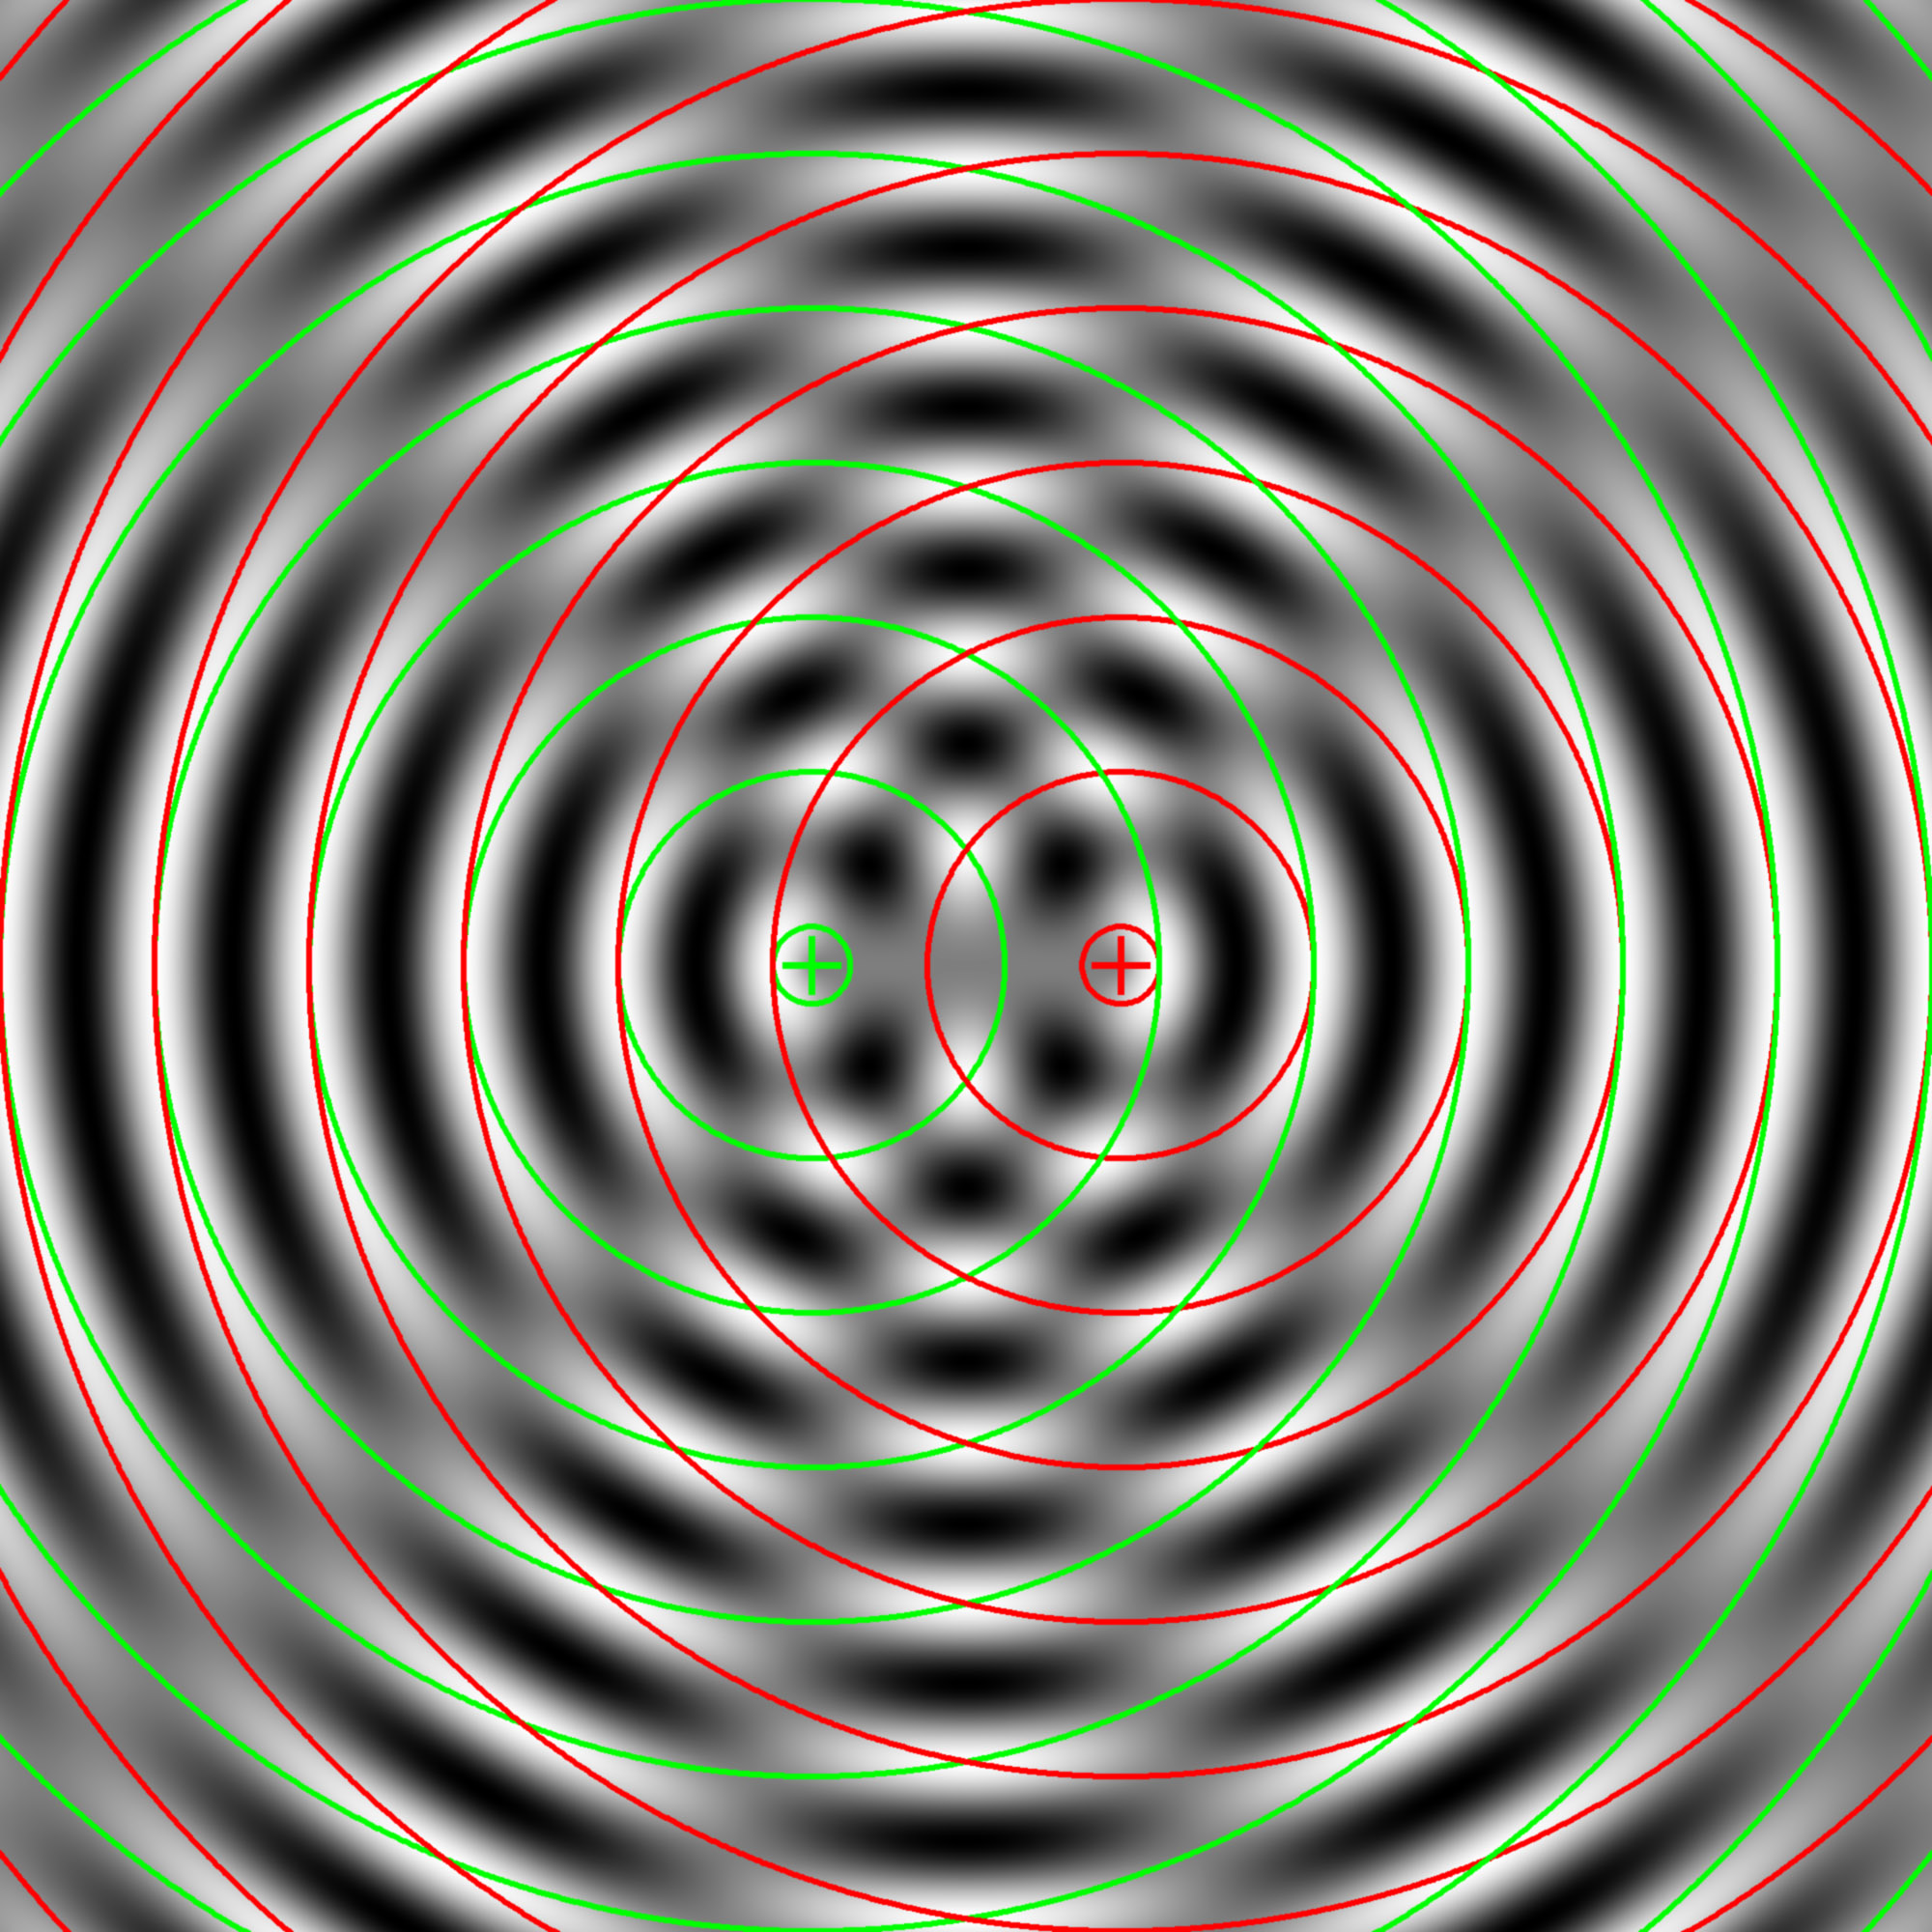
Deutsch: Simuliertes Interferenzbild zweier punktförmiger Quellen mit gleicher Wellenlänge. Die Lagen der Quellen sind durch Kreuze gekennzeichnet, die Maxima beider Wellen durch farbige Kreise. |
| 日期 | |
| 來源 | 自己的作品 |
| 作者 | Dr. Schorsch 12:32, 19 Apr 2005 (UTC) (Dr. Schorsch (talk)) |
授權條款
我,本作品的著作權持有者,決定用以下授權條款發佈本作品:

|
已授權您依據自由軟體基金會發行的無固定段落、封面文字和封底文字GNU自由文件授權條款1.2版或任意後續版本,對本檔進行複製、傳播和/或修改。該協議的副本列在GNU自由文件授權條款中。 |
您可以選擇您需要的授權條款。
Source Code
This is the source code of the program I used to create this image. Click on “Show source code” to display it.
The following program is under the GNU General Public License (GPL).
|
|
此作品為自由軟體;您可依自由軟體基金會所發表的GNU通用公共授權條款的條款散佈與/或修改,無論您依據的是本授權條款的第2版本或之後的任何版本。本作品發佈的目的是希望可以提供幫助,但不負任何擔保責任;亦無隱含對適售性或特定用途的適用性的情形擔保。請參考GNU通用公共授權條款的第2版與第3版。 |
; Program Written in IDL (Interactive Data Language)
; Free Interpreter availible at www.rsinc.com
; Written by Georg Wiora
; This Program is under the  GNU General Public License (GPL)
;
; Create a display of interference patterns
; Save this text as file "Interference2.pro" to run it.

; Draw a circle
PRO circle,x,y,r,_REF_EXTRA=ex
  n=ULONG(!DPI*r) > 1
  phi = FINDGEN(n)/FLOAT(n)*2*!DPI
  x1 = r*COS(phi)+x
  y1 = r*SIN(phi)+y
  PLOTS,[x1,x1[0]],[y1,y1[0]],_STRICT_EXTRA=ex
END

; Compute the interference
PRO Interference2
   ; Final Image Size
  siz=2000
  ; No display if larger than 800x1600 pixel
  pixmap=SIZ GT 800
  ; Wavelength in Pixel
  lambda=160
  ; Half distance of the sources
  dhalb = lambda

  ; Compute the distance of each point in an array from the
  ; center point: This is the phase of the signal
  d1 = SHIFT(DIST(siz*2,siz),siz,siz/2)
  ; Sinus of distace with 0 LE amplitude LE 2
  f = SIN(d1/lambda*2*!DPI)+1
  ; Compute Interference
  inter = SHIFT(f,-dhalb,0)+SHIFT(f,dhalb,0)
  ; Get maximum and minimum
  ma = MAX(inter,MIN=mi)
  ; Two colors are reserved for marking, the rest is gray scale
  ; Scale interference to byte range [0..253]
  inter = BYTE((TEMPORARY(inter)-mi)/(ma-mi)*253)

  ; Use lookup table to display
  DEVICE,DECOMPOSED=0
  ; Gray scale
  LOADCT,0
  ; Half length of center cross bars in pixel
  cs=30
  ; Half width of center cross bars in pixel
  cb=3

  ; Set mark for center
  ; Horizontal left
  inter[siz-dhalb-cs:siz-dhalb+cs, siz/2-cb:siz/2+cb] = 254
  ; Vertical left
  inter[siz-dhalb-cb:siz-dhalb+cb, siz/2-cs:siz/2+cs] = 254
  ; Horizontal right
  inter[siz+dhalb-cs:siz+dhalb+cs, siz/2-cb:siz/2+cb] = 255
  ; Vertical right
  inter[siz+dhalb-cb:siz+dhalb+cb, siz/2-cs:siz/2+cs] = 255

  ; Open a visible or invisible window (depends on pixmap flag)
  WINDOW,XSIZE=2*siz,YSIZE=siz,PIXMAP=pixmap
  ; Display the interference (only gray scale!)
  TV,inter
  ; Draw circles on maximum locations
  FOR i=0,2.5*siz/lambda DO $
  BEGIN
    ; Maximum location left
    circle,siz-dhalb,siz/2,(i+0.25)*lambda,THICK=6,/DEVICE,COLOR=254
    ; Maximum location right
    circle,siz+dhalb,siz/2,(i+0.25)*lambda,THICK=6,/DEVICE,COLOR=255
  ENDFOR

  ; Colortable 0-253 as gray scake
  r = FINDGEN(256)/253*255
  g=r
  b=r
  ; 254 is green
  r[254]=0
  b[254]=0
  g[254]=255
  ; 255 is red
  r[255]=255
  b[255]=0
  g[255]=0

  ; Read image from display
  im=TVRD()
  ; Crop invalid borders
  im = im[siz/2:3*siz/2-1,*]

  ; Save as PNG with colortable
  WRITE_PNG,'Interference2.png',im,r,g,b
  ; Convert to truecolor and write JPEG
  imt = [[[r[im]]],[[g[im]]],[[b[im]]]]
  ; smooth image a little bit (saves bandwith in jpeg and is OK
  ; with high resolution)
  imt[*,*,0] = SMOOTH(imt[*,*,0],3,/EDGE_TRUNCATE)
  imt[*,*,1] = SMOOTH(imt[*,*,1],3,/EDGE_TRUNCATE)
  imt[*,*,2] = SMOOTH(imt[*,*,2],3,/EDGE_TRUNCATE)
  ; Write as jpeg
  WRITE_JPEG,'Interference2.jpg',TEMPORARY(imt),/PROGRESSIVE,$
             QUALITY=90, TRUE=3
END
檔案歷史
點選日期/時間以檢視該時間的檔案版本。
| 日期/時間 | 縮圖 | 尺寸 | 用戶 | 備註 | |
|---|---|---|---|---|---|
| 目前 | 2005年4月19日 (二) 14:26 | | 2,000 × 2,000(634 KB) | Xorx | |
| 2005年4月19日 (二) 12:28 |  | 2,000 × 2,000(310 KB) | Xorx | Simuliertes Interferenzbild zweier punktförmiger Quellen mit gleicher Wellenlänge. {{GFDL}} |
檔案用途
下列3個頁面有用到此檔案:
全域檔案使用狀況
以下其他 wiki 使用了這個檔案:
- bs.wikipedia.org 的使用狀況
- ca.wikipedia.org 的使用狀況
- da.wikipedia.org 的使用狀況
- de.wikipedia.org 的使用狀況
- fr.wikipedia.org 的使用狀況
- fr.wikibooks.org 的使用狀況
- fr.wikiversity.org 的使用狀況
- hr.wikipedia.org 的使用狀況
- it.wikipedia.org 的使用狀況
- it.wikiversity.org 的使用狀況
- ja.wikipedia.org 的使用狀況
- ja.wikibooks.org 的使用狀況
- lb.wikipedia.org 的使用狀況
- no.wikibooks.org 的使用狀況
- pl.wiktionary.org 的使用狀況
- sh.wikipedia.org 的使用狀況
- simple.wikipedia.org 的使用狀況
- sk.wikipedia.org 的使用狀況
- sr.wikipedia.org 的使用狀況
- te.wikipedia.org 的使用狀況
- th.wikipedia.org 的使用狀況