File:Targzip.svg

此 SVG 檔案的 PNG 預覽的大小:800 × 207 像素。 其他解析度:320 × 83 像素 | 640 × 165 像素 | 1,024 × 265 像素 | 1,280 × 331 像素 | 2,560 × 662 像素 | 1,814 × 469 像素。
原始檔案 (SVG 檔案,表面大小:1,814 × 469 像素,檔案大小:6 KB)
摘要
| 描述 |
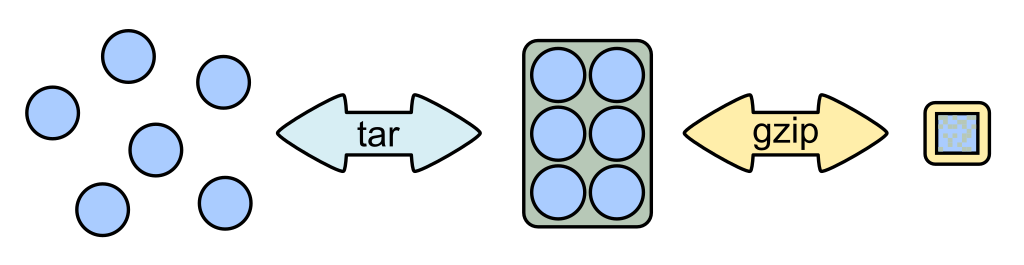
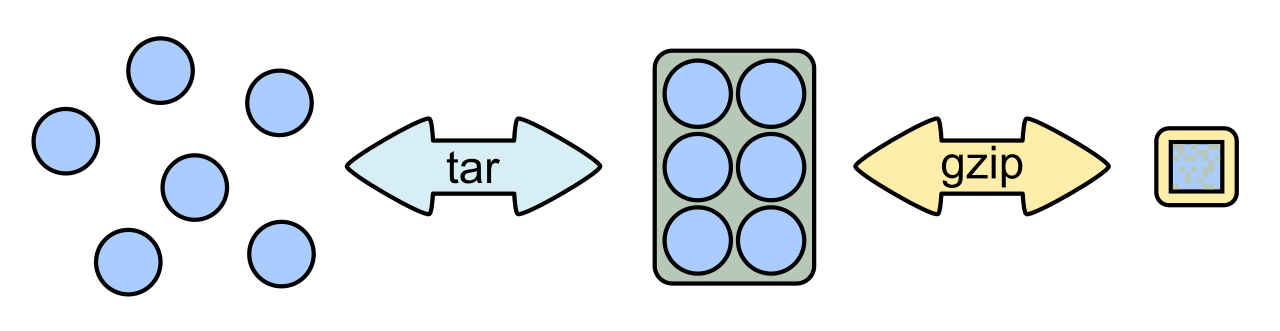
English: Schema of tar-creation and compressing via gzip. In this diagram, the entropy of data corresponds with how much of the data can fit in a square of the same width and height: the more that can fit, the more it has been compressed and the higher the entropy. The files are represented as circles and the gzip stream is represented as a square to show the change in entropy.
The tar container data occupies space equal to the area of the green rectangle (shown in the middle), and the file data occupies space equal to the area to the blue circles. Mathematically, they are in a ratio approximately 25:39, respectively. 64 blocks are shown in the gzip stream: the 25 green blocks are compressed tar container data and the 39 blue blocks are compressed file data. In real-world situations, certain data would be difficult to compress, such as a JPG image, and in the gzip stream, it would consume several times more data than the tar container data as tar data is relatively simple to compress. Other types of data, such as those with unusually long run-lengths, might be easier to compress than tar data.
Esperanto: Skemo de kunigo de dosieroj per tar kaj densigo de la arkivo per gzip
|
| 日期 | 03.07.2008 |
| 來源 | 自己的作品 |
| 作者 | Th0msn80 |
| 其他版本 | Image:Targzip.jpg |
授權條款
我,本作品的著作權持有者,決定用以下授權條款發佈本作品:
此檔案採用創用CC 姓名標示 3.0 未在地化版本授權條款。
- 您可以自由:
- 分享 – 複製、發佈和傳播本作品
- 重新修改 – 創作演繹作品
- 惟需遵照下列條件:
- 姓名標示 – 您必須指名出正確的製作者,和提供授權條款的連結,以及表示是否有對內容上做出變更。您可以用任何合理的方式來行動,但不得以任何方式表明授權條款是對您許可或是由您所使用。
檔案歷史
點選日期/時間以檢視該時間的檔案版本。
| 日期/時間 | 縮圖 | 尺寸 | 使用者 | 備註 | |
|---|---|---|---|---|---|
| 目前 | 2023年8月27日 (日) 17:53 | 1,814 × 469(6 KB) | Phreneticc | little compressed | |
| 2010年9月27日 (一) 16:37 | 1,814 × 469(19 KB) | Iago4096 | Made the writing slightly smaller so that it does not clash with the lines in the arrows | ||
| 2010年8月4日 (三) 06:06 | 1,814 × 469(17 KB) | X-Fi6 | After looking over the diagram, I decided it would be more accurate and make more sense if I made these changes. The ratio of compressed tar blocks to compressed data blocks (25:39) in the gzip stream is the same ratio as uncompressed tar data to uncompr | ||
| 2010年8月4日 (三) 02:26 | 1,814 × 469(13 KB) | X-Fi6 | Made one final update: changed blue square to yellow to indicate that it is gzip data and requires decompressing. | ||
| 2010年8月4日 (三) 02:09 | 1,814 × 469(13 KB) | X-Fi6 | Added blue square data in the gzipped tar archive | ||
| 2008年7月3日 (四) 10:51 | 1,814 × 469(18 KB) | Th0msn80 | {{Information |Description={{en|1=Schema of tar-creation and compressing via gzip}} |Source=Own work by uploader |Author=Th0msn80 |Date=03.07.2008 |Permission= |other_versions=Bild:Targzip.jpg }} {{ImageUpload|full}} |
檔案用途
下列頁面有用到此檔案:
全域檔案使用狀況
以下其他 wiki 使用了這個檔案:
- de.wikipedia.org 的使用狀況
- en.wikipedia.org 的使用狀況
- fr.wikipedia.org 的使用狀況
- fr.wikibooks.org 的使用狀況
- id.wikipedia.org 的使用狀況
- ja.wikipedia.org 的使用狀況
- ko.wikipedia.org 的使用狀況
- ru.wikipedia.org 的使用狀況
- uk.wikipedia.org 的使用狀況