File:2016 Pacific typhoon season summary.png
本预览的尺寸:800 × 600像素。 其他分辨率:320 × 240像素 | 640 × 480像素 | 1,024 × 768像素 | 1,280 × 960像素 | 2,560 × 1,920像素 | 4,000 × 3,000像素。
原始文件 (4,000 × 3,000像素,文件大小:7.7 MB,MIME类型:image/png)
摘要
| 描述 |
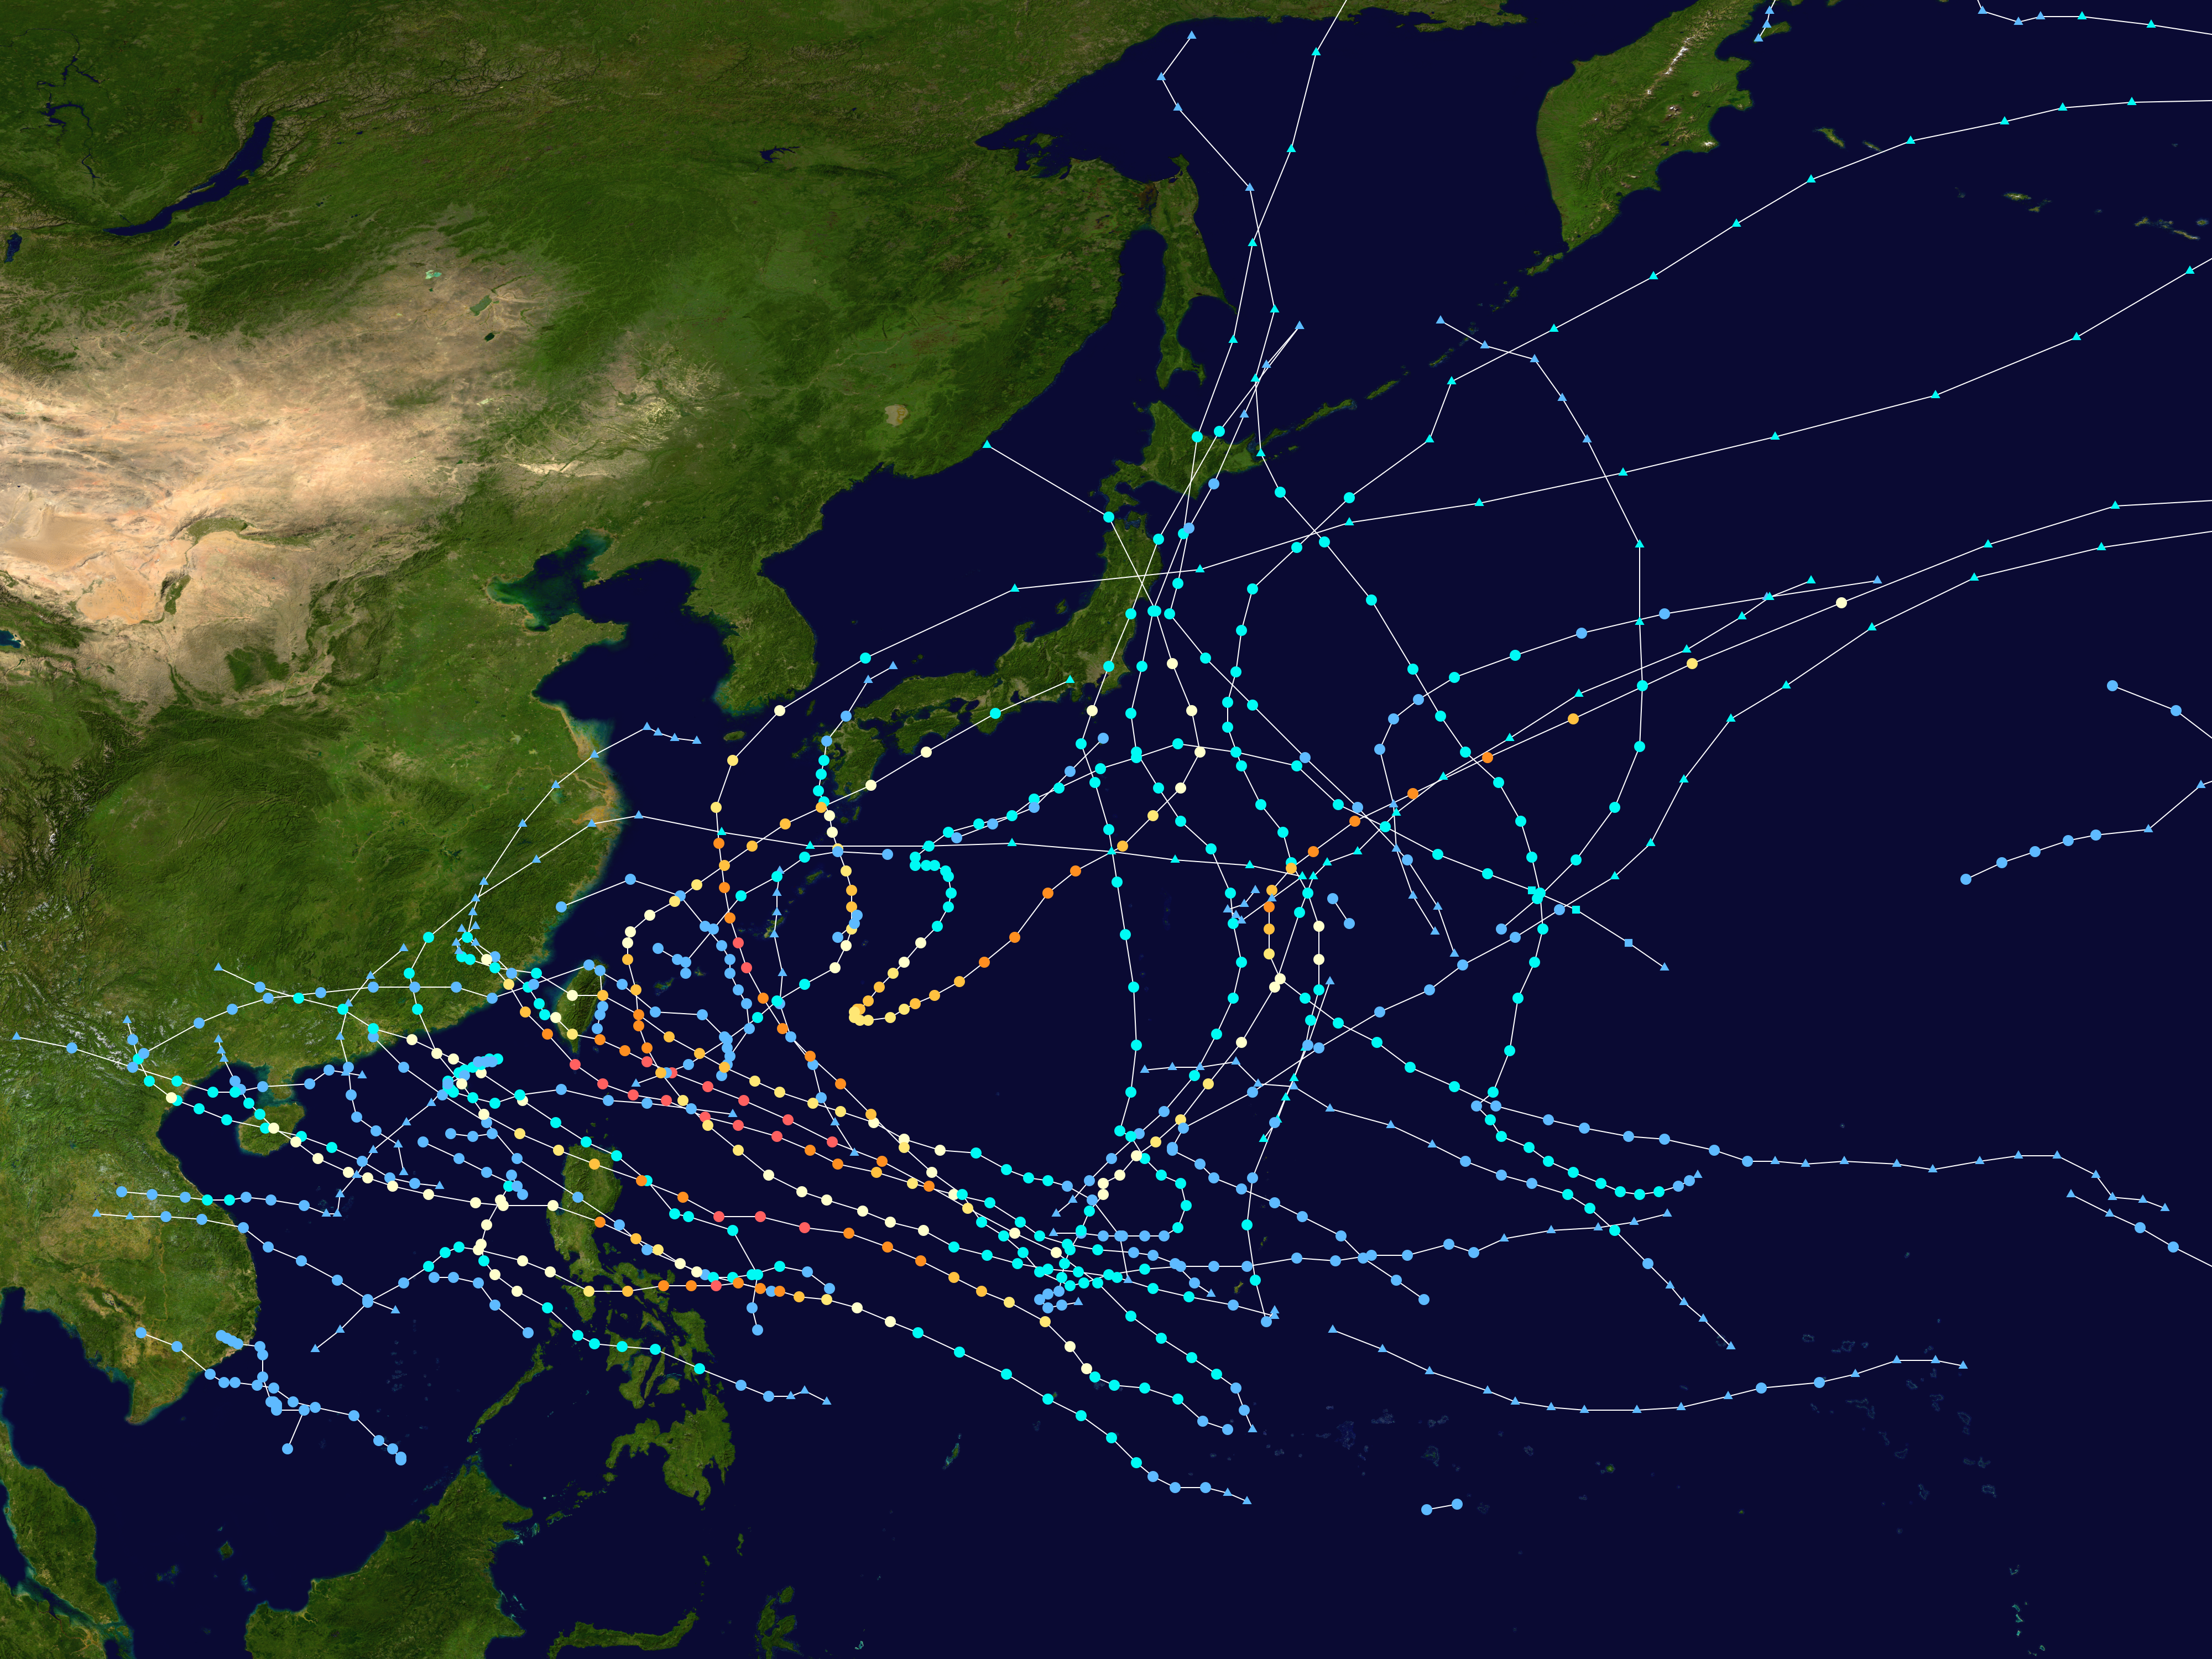
English: This map shows the tracks of all tropical cyclones in the 2016 Pacific typhoon season. The points show the location of each storm at 6-hour intervals. The colour represents the storm's maximum sustained wind speeds as classified in the Saffir-Simpson Hurricane Scale (see below), and the shape of the data points represent the type of the storm.
Tropical depression (≤38 mph, ≤62 km/h)
Tropical storm (39–73 mph, 63–118 km/h)
Category 1 (74–95 mph, 119–153 km/h)
Category 2 (96–110 mph, 154–177 km/h)
Category 3 (111–129 mph, 178–208 km/h)
Category 4 (130–156 mph, 209–251 km/h)
Category 5 (≥157 mph, ≥252 km/h)
Unknown
Storm type |
| 来源 | Created using Wikipedia:WikiProject Tropical cyclones/Tracks. The background image is from NASA [1]. The tracking data is from the Joint Typhoon Warning Center's best track database |
| 作者 | Supportstorm |
| 本作品已被作者Supportstorm释出到公有领域。这适用于全世界。 在一些国家这可能不合法;如果是这样的话,那么: Supportstorm无条件地授予任何人以任何目的使用本作品的权利,除非这些条件是法律规定所必需的。 |
文件历史
点击某个日期/时间查看对应时刻的文件。
| 日期/时间 | 缩略图 | 大小 | 用户 | 备注 | |
|---|---|---|---|---|---|
| 当前 | 2020年2月16日 (日) 02:50 | | 4,000 × 3,000(7.7 MB) | Supportstorm | Primarily JTWC/JMA data |
| 2018年12月9日 (日) 05:29 |  | 4,000 × 3,400(10.42 MB) | Supportstorm | Reverted to version as of 05:01, 16 March 2018 (UTC) | |
| 2018年8月30日 (四) 16:23 |  | 4,000 × 3,000(9.98 MB) | David Petrovsky | Added also features known as the dimensions and size | |
| 2018年3月16日 (五) 05:01 |  | 4,000 × 3,400(10.42 MB) | Supportstorm | Best track update | |
| 2017年5月14日 (日) 06:45 |  | 4,000 × 2,942(8.26 MB) | Supportstorm | Reverted to version as of 21:26, 22 February 2017 (UTC) | |
| 2017年4月28日 (五) 03:22 |  | 4,000 × 3,375(10.3 MB) | Morgan Siu | ||
| 2017年2月22日 (三) 21:26 |  | 4,000 × 2,942(8.26 MB) | Supportstorm | Update (JMA weather map reanalysis up to October 31) | |
| 2016年12月23日 (五) 09:17 |  | 4,000 × 3,375(10.3 MB) | Supportstorm | Update (JMA weather map reanalysis up to August 31) | |
| 2016年11月15日 (二) 13:43 |  | 4,000 × 3,375(10.26 MB) | Supportstorm | Update | |
| 2016年10月30日 (日) 01:19 |  | 4,000 × 3,375(10.14 MB) | Supportstorm | Update |
文件用途
以下30个页面使用本文件:
- 2016年11月越南熱帶低氣壓
- 2016年太平洋颱風季
- 強烈熱帶風暴妮妲 (2016年)
- 強烈熱帶風暴燦都 (2016年)
- 強烈熱帶風暴艾利 (2016年)
- 強烈熱帶風暴蝎虎 (2016年)
- 強烈熱帶風暴銀河 (2016年)
- 熱帶低氣壓WP012016
- 熱帶風暴圓規 (2016年)
- 熱帶風暴康森 (2016年)
- 熱帶風暴瑪瑙 (2016年)
- 熱帶風暴雷伊 (2016年)
- 熱帶風暴電母 (2016年)
- 颱風南修 (2016年)
- 颱風尼伯特 (2016年)
- 颱風暹芭 (2016年)
- 颱風桑達 (2016年)
- 颱風海馬 (2016年)
- 颱風獅子山 (2016年)
- 颱風納坦 (2016年)
- 颱風莎莉嘉 (2016年)
- 颱風莫蘭蒂 (2016年)
- 颱風蒲公英 (2016年)
- 颱風馬勒卡 (2016年)
- 颱風鮎魚 (2016年)
- User:Weather Synchronize/沙盒1
- User:Weather Synchronize/沙盒2
- Template:2016年太平洋颱風季
- WikiProject:太平洋颱風季/編輯指南/詳情
- WikiProject:热带气旋/编辑指南
全域文件用途
以下其他wiki使用此文件:
- bcl.wikipedia.org上的用途
- de.wikipedia.org上的用途
- en.wikipedia.org上的用途
- 2016 Pacific typhoon season
- Timeline of the 2016 Pacific typhoon season
- Template:2016 Pacific typhoon season buttons
- Typhoon Nepartak
- Tropical Storm Mirinae (2016)
- Tropical Storm Nida (2016)
- Tropical Storm Dianmu (2016)
- Typhoon Mindulle (2016)
- Typhoon Lionrock
- User:Nino Marakot/2016 Pacific typhoon season
- Typhoon Meranti
- Typhoon Malakas (2016)
- Tropical Storm Rai (2016)
- Typhoon Megi (2016)
- Typhoon Chaba (2016)
- Typhoon Songda (2016)
- Typhoon Sarika
- Typhoon Haima
- November 2016 Vietnam tropical depression
- Tropical Storm Aere (2016)
- User:Typhoon2013/PTS Format 1A
- Typhoon Nock-ten
- User:Tfmbty/2016 Pacific typhoon season
- Tropical cyclones in 2016
- User:HUYTK21
- es.wikipedia.org上的用途
- ja.wikipedia.org上的用途
- ko.wikipedia.org上的用途
- pt.wikipedia.org上的用途
- th.wikipedia.org上的用途
- tl.wikipedia.org上的用途
- vi.wikipedia.org上的用途
- www.wikidata.org上的用途
- zh-yue.wikipedia.org上的用途