File:Aquatic Dead Zones.jpg

本预览的尺寸:800 × 468像素。 其他分辨率:320 × 187像素 | 640 × 375像素 | 1,024 × 599像素 | 1,280 × 749像素 | 2,560 × 1,499像素 | 3,577 × 2,094像素。
原始文件 (3,577 × 2,094像素,文件大小:856 KB,MIME类型:image/jpeg)
摘要
| 描述 |
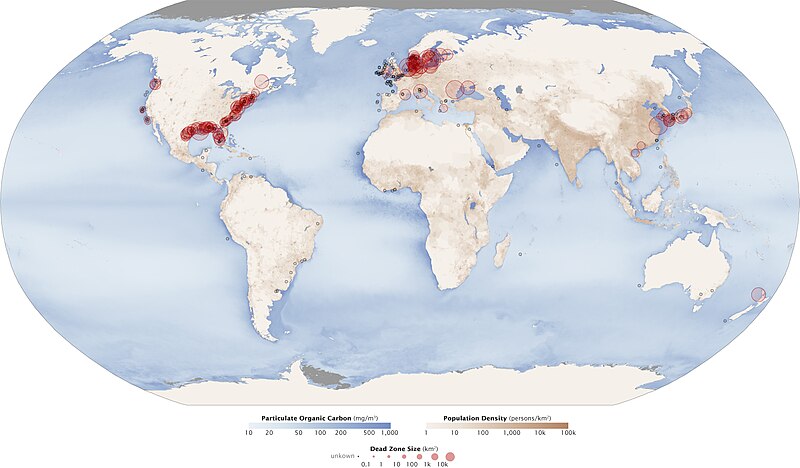
English: Red circles on this map show the location and size of many of our planet’s dead zones. Black dots show where dead zones have been observed, but their size is unknown. It’s no coincidence that dead zones occur downriver of places where human population density is high (darkest brown). Darker blues in this image show higher concentrations of particulate organic matter, an indication of the overly fertile waters that can culminate in dead zones. |
| 日期 | |
| 来源 | NASA Earth Observatory |
| 作者 | Robert Simmon & Jesse Allen |
Data from Robert Diaz, Virginia Institute of Marine Science (dead zones); the GSFC Ocean Color team (particulate organic carbon); and the Socioeconomic Data and Applications Center (SEDAC) (population density).
许可协议
| 本文件完全由NASA创作,在美国属于公有领域。根据NASA的版权方针,NASA的材料除非另有声明否则不受版权保护。(参见Template:PD-USGov/zh、NASA版权方针页面或JPL图片使用方针。) | ||
 |
警告:
|
文件历史
点击某个日期/时间查看对应时刻的文件。
| 日期/时间 | 缩略图 | 大小 | 用户 | 备注 | |
|---|---|---|---|---|---|
| 当前 | 2010年7月19日 (一) 12:17 | | 3,577 × 2,094(856 KB) | Originalwana | {{Information |Description={{en|1=Red circles on this map show the location and size of many of our planet’s dead zones. Black dots show where dead zones have been observed, but their size is unknown. It’s no coincidence that dea |
文件用途
以下页面使用本文件:
全域文件用途
以下其他wiki使用此文件:
- ar.wikipedia.org上的用途
- bs.wikipedia.org上的用途
- cs.wikipedia.org上的用途
- da.wikipedia.org上的用途
- de.wikipedia.org上的用途
- en.wikipedia.org上的用途
- en.wikibooks.org上的用途
- es.wikipedia.org上的用途
- fa.wikipedia.org上的用途
- fr.wikipedia.org上的用途
- it.wikipedia.org上的用途
- ja.wikipedia.org上的用途
- ml.wikipedia.org上的用途
- pl.wikipedia.org上的用途
- pt.wikipedia.org上的用途
- ru.wikipedia.org上的用途
- simple.wikipedia.org上的用途
- tr.wikipedia.org上的用途
- uk.wikipedia.org上的用途