File:Countries by Human Development Index (2019).png

本预览的尺寸:800 × 361像素。 其他分辨率:320 × 145像素 | 640 × 289像素 | 1,024 × 462像素 | 1,280 × 578像素 | 2,560 × 1,156像素 | 6,060 × 2,737像素。
原始文件 (6,060 × 2,737像素,文件大小:1.49 MB,MIME类型:image/png)
.png?uselang=zh)
.png?uselang=zh)
.png?action=history&uselang=zh)
.png)
摘要
| 描述 |
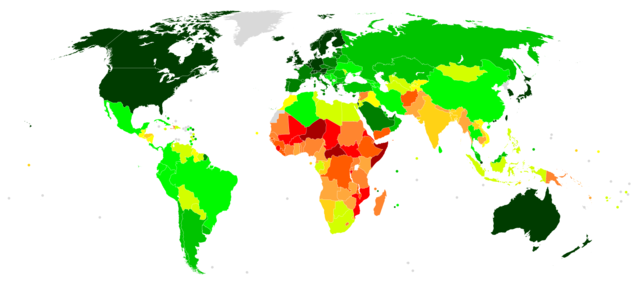
English: A choropleth map showing countries and territories by Human Development Index, based on 2018 data from the 2019 Human Development Report. Data for Macau is calculated by the Government of Macau, published in 2019, showing 2017 data, while data for Taiwan is calculated by the Government of Taiwan, published in 2019, showing 2017 data. 2017 data is shown for Somalia according to Global Data Lab.
≥ 0.900
0.850–0.899
0.800–0.849
0.750–0.799
0.700–0.749
0.650–0.699
0.600–0.649
0.550–0.599
0.500–0.549
0.450–0.499
0.400–0.449
≤ 0.399
Data unavailable |
| 日期 | |
| 来源 | 自己的作品 |
| 作者 | JackintheBox |
许可协议
| 此地图不符合版权的资格,因此属于公有领域,因为其完全包含公共财产信息,不包含原作者身份。详情参见Commons:Threshold of originality § Maps。
|
文件历史
点击某个日期/时间查看对应时刻的文件。
| 日期/时间 | 缩略图 | 大小 | 用户 | 备注 | |
|---|---|---|---|---|---|
| 当前 | 2019年12月10日 (二) 12:43 | | 6,060 × 2,737(1.49 MB) | JackintheBox | {{Information |description ={{en|1=A choropleth map showing countries and territories by Human Development Index, based on 2018 data from the [http://hdr.undp.org/sites/default/files/hdr_2019_overview_-_english.pdf 2019 Human Development Report]. Data for Macau is calculated by the [https://www.dsec.gov.mo/getAttachment/5c26bbdf-77c7-48aa-bb1f-a1537a2b220d/E_MN_PUB_2018_Y.aspx Government of Macau], published in 2019, showing 2017 data, while data for Taiwan is calculated by the [http://eng.... |
文件用途
以下页面使用本文件:
全域文件用途
以下其他wiki使用此文件:
- de.wikipedia.org上的用途
- id.wikipedia.org上的用途
.png)