File:Dandelion clock quarter dft dct.png

原始文件 (1,140 × 1,428像素,文件大小:542 KB,MIME类型:image/png)
摘要
| 描述 | the picture shows the difference between the DFT and a DCT of an image |
| 日期 | |
| 来源 | I made it by myself |
| 作者 | Alessio Damato |
| 授权 (二次使用本文件) |
multilicensed (see below) |
| 其他版本 | the original image that was processed was Image:Dandelion_clock.jpg |
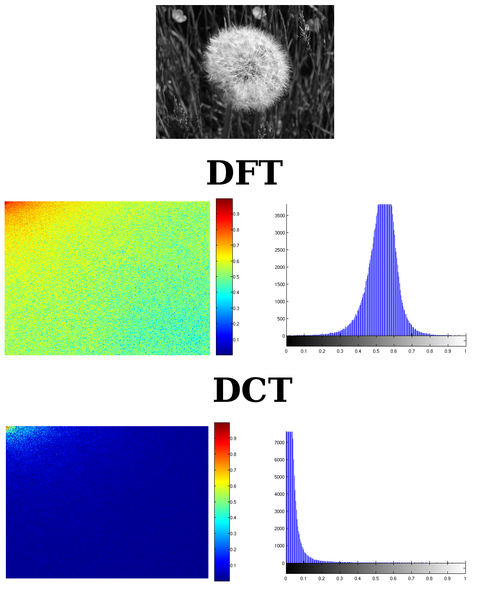
I used Image:Dandelion_clock.jpg to create this image. I wanted to show clearly the different behavior between the DFT and the DCT in the frequency domain.
The pictures are made of other figures. The first one on the top is just the original image: I used its gray-scale version. On the second line there is the DFT: its magnitude on the left, its histogram on the right. On the third line there is the DCT, with both magnitude and histogram.
The spectrum of the DFT has cropped so that the lowest frequencies are on the top-left of the picture, just like in the DCT. It is not such a rigorous process: the DFT in general is composed of two symmetric halves, but I put on the picture just one quarter, thus removing one quarter of necessary information. I did so to create an output that could be easily be compared with the DCT. Because of symmetry, I cropped to 1/4 the DCT as well, keeping the lower frequencies. Anyway it is clear how the DCT concentrates most of the energy into the lowest frequencies.
I created the single images with the following Matlab code:
% read the image
RGB = imread('Dandelion_clock.jpg');
% convert pixels to the [0 1] range
RGB = im2double(RGB);
% convert to grayscale
I = rgb2gray(RGB);

% calculate the size of the image and then divide
% by two, in order to crop it later
[X Y] = size(I);
Y = round(Y/2);
X = round(X/2);

% evaluate magnitude of the DFT
F = abs(fft2(I));
% take only a quarter
F = imcrop(F,[0 0 Y X]);
% use log scale
F = log(1 + F);
F = log(1 + F);
% normalize
F = F/max(F(:));

% evaluate magnitude of the DCT
C = abs(dct2(I));
% take only a quarter
C = imcrop(C,[0 0 Y X]);
% use log scale
C = log(1 + C);
C = log(1 + C);
% normalize
C = C/max(C(:));

% show all the results
imshow(F), colorbar, colormap(jet);
figure, imhist(F);
figure, imshow(C), colorbar, colormap(jet);
figure, imhist(C);
First it imports the RGB image and converts it to gray-scale. Then calculates the magnitude of both the transforms. Both pictures had a huge dynamic, so I calculated the logarithm of both, twice, in order to be able to show the transforms properly. Once all the pictures were shown on the screen, I just selected File -> Save as on Matlab to save all the pictures. I put them all together using Gimp.
(comment by RCL) I cant speak english very well, but I'm going to try it. The use of this code it's WRONG, we can't use this MATLAB code for comparing both transforms, because in MATLAB the definition of the DFT isn't normalized and the definition of the DCT in MATLB it's normalized. So we should multiply the result of the fft by a factor of 1.0/N², before we use the function abs. The result between the DFT and the DCT is very similar if we do this, but we can obtain the shannon entropy of the energy of both transforms and the result is that the entropy of the energy in the DCT is lower than the DFT, for that reason we say that the DCT compact the energy more than the DFT. I made my master thesis on the DCT.
许可协议

|
已授权您依据自由软件基金会发行的无固定段落及封面封底文字(Invariant Sections, Front-Cover Texts, and Back-Cover Texts)的GNU自由文件许可协议1.2版或任意后续版本的条款,复制、传播和/或修改本文件。该协议的副本请见“GNU Free Documentation License”。 |
| 本文件采用知识共享署名-相同方式共享 3.0 未本地化版本许可协议授权。 | ||
| ||
| 本许可协议标签作为GFDL许可协议更新的组成部分被添加至本文件。 |
- 您可以自由地:
- 共享 – 复制、发行并传播本作品
- 修改 – 改编作品
- 惟须遵守下列条件:
- 署名 – 您必须对作品进行署名,提供授权条款的链接,并说明是否对原始内容进行了更改。您可以用任何合理的方式来署名,但不得以任何方式表明许可人认可您或您的使用。
- 相同方式共享 – 如果您再混合、转换或者基于本作品进行创作,您必须以与原先许可协议相同或相兼容的许可协议分发您贡献的作品。
文件历史
点击某个日期/时间查看对应时刻的文件。
| 日期/时间 | 缩略图 | 大小 | 用户 | 备注 | |
|---|---|---|---|---|---|
| 当前 | 2006年5月13日 (六) 18:50 | | 1,140 × 1,428(542 KB) | Alejo2083 | == Summary == {{Information| |Description= the picture shows the difference between the DFT and a DCT of an image |Source= I made it by myself |Date= 13/05/2006 |Author= Alessio Damato |Permission= multilicensed (see below) |other_versions= the original |
文件用途
以下页面使用本文件:
全域文件用途
以下其他wiki使用此文件:
- ar.wikipedia.org上的用途
- ca.wikipedia.org上的用途
- cs.wikipedia.org上的用途
- es.wikipedia.org上的用途
- eu.wikipedia.org上的用途
- it.wikipedia.org上的用途
- ja.wikipedia.org上的用途
- pt.wikipedia.org上的用途