File:Gdp-and-labour-force-by-sector.png
本预览的尺寸:680 × 599像素。 其他分辨率:272 × 240像素 | 545 × 480像素 | 871 × 768像素 | 1,162 × 1,024像素 | 1,425 × 1,256像素。
原始文件 (1,425 × 1,256像素,文件大小:116 KB,MIME类型:image/png)
摘要
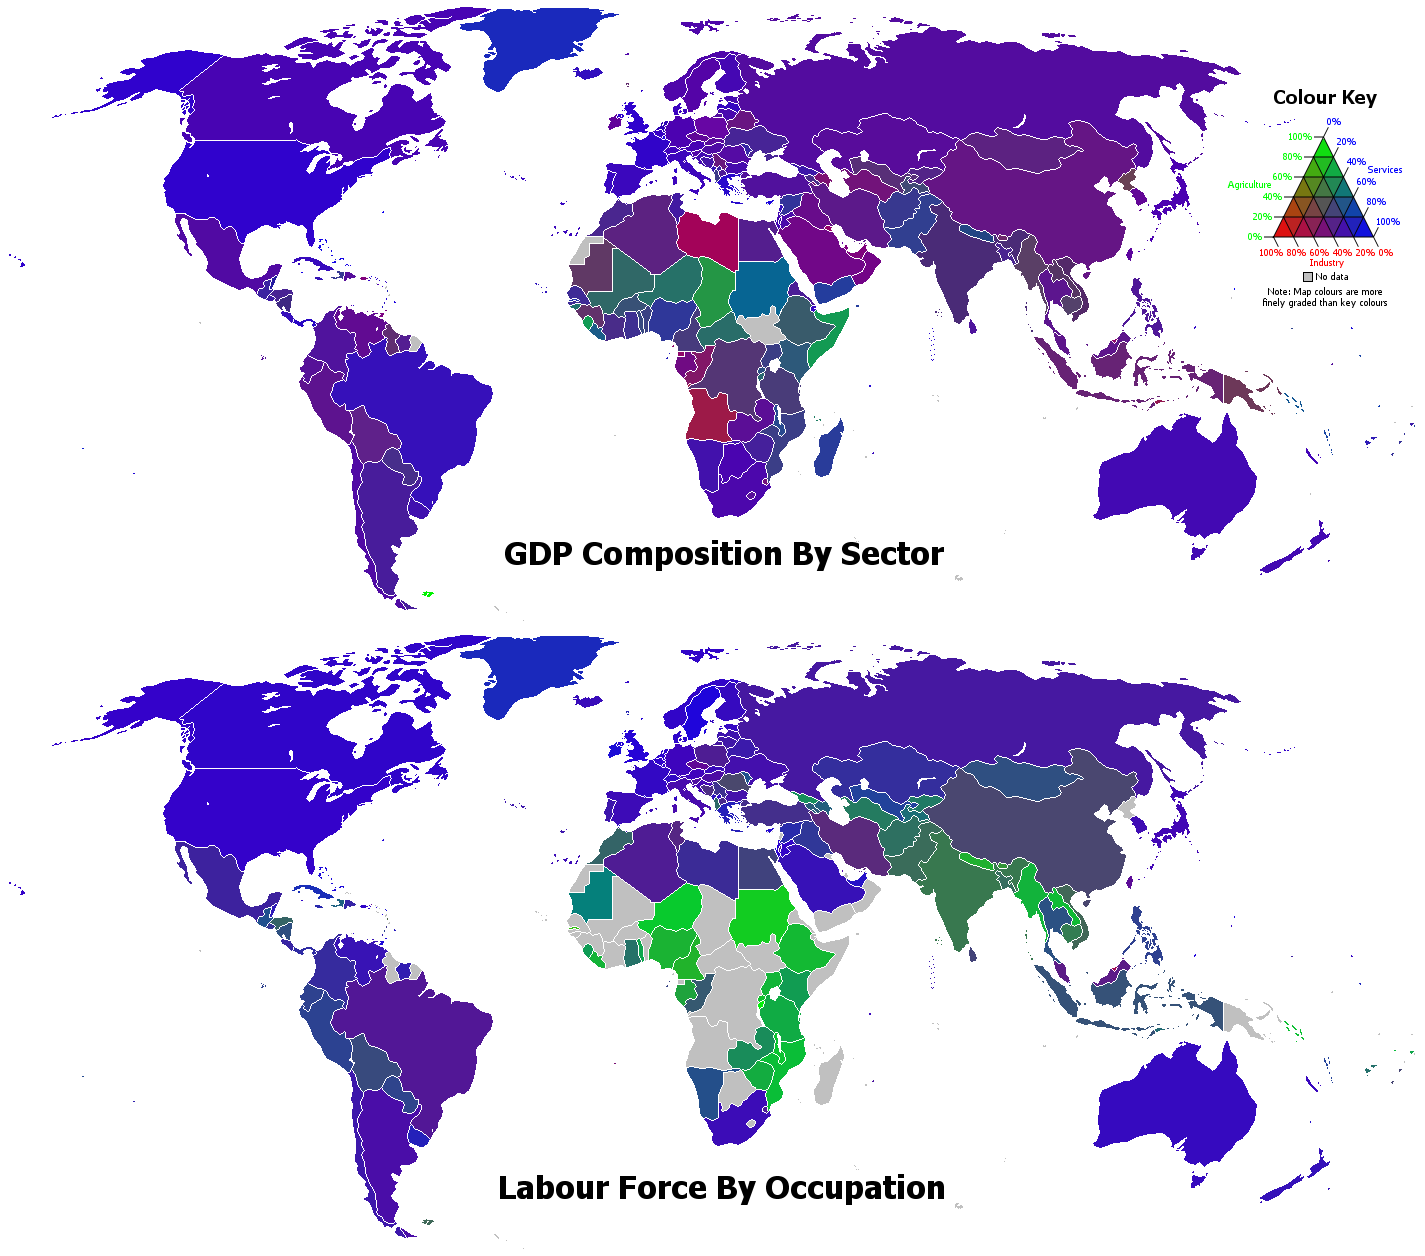
| 描述 | GDP Composition By Sector and Labour Force By Occupation, produced using data from the CIA World Factbook 2006. The green, red, and blue components of the colors of the countries represent the percentages for the agriculture, industry, and services sectors respectively, as summarized on the color key - for example, rgb(102,51,201) represents 20% agriculture, 40% industry, and 40% services. |
| 日期 | UTC |
| 来源 | 自己的作品 |
| 作者 | Safalra (Stephen Morley) |
许可协议
| 我,本作品著作权人,释出本作品至公有领域。这适用于全世界。 在一些国家这可能不合法;如果是这样的话,那么: 我无条件地授予任何人以任何目的使用本作品的权利,除非这些条件是法律规定所必需的。 |
文件历史
点击某个日期/时间查看对应时刻的文件。
| 日期/时间 | 缩略图 | 大小 | 用户 | 备注 | |
|---|---|---|---|---|---|
| 当前 | 2018年10月30日 (二) 02:21 | | 1,425 × 1,256(116 KB) | Ketrit | Minor fixes |
| 2018年10月30日 (二) 01:38 |  | 1,425 × 1,256(116 KB) | Ketrit | Updated for 2018. | |
| 2006年9月18日 (一) 15:27 |  | 1,357 × 1,256(90 KB) | Safalra | {{Information |Description = GDP Composition By Sector and Labour Force By Occupation, produced using data from the CIA World Factbook 2006. The green, red, and blue components of the colours of the countries represent the percentages for the agriculture, | |
| 2006年9月18日 (一) 15:21 |  | 1,357 × 1,256(90 KB) | Safalra | == Summary == {{Information |Description = GDP Composition By Sector and Labour Force By Occupation, produced using data from the CIA World Factbook 2006. The green, red, and blue components of the colours of the countries represent the percentages for th |
文件用途
全域文件用途
以下其他wiki使用此文件:
- ar.wikipedia.org上的用途
- br.wikipedia.org上的用途
- ca.wikipedia.org上的用途
- ceb.wikipedia.org上的用途
- ckb.wikipedia.org上的用途
- co.wikipedia.org上的用途
- crh.wikipedia.org上的用途
- cs.wikipedia.org上的用途
- da.wikipedia.org上的用途
- el.wikipedia.org上的用途
- en.wikipedia.org上的用途
- fa.wikipedia.org上的用途
- fr.wikipedia.org上的用途
- hi.wikipedia.org上的用途
- hu.wikipedia.org上的用途
- hy.wikipedia.org上的用途
- it.wikipedia.org上的用途
- it.wikibooks.org上的用途
- ja.wikipedia.org上的用途
- kk.wikipedia.org上的用途
- ko.wikipedia.org上的用途
- lez.wikipedia.org上的用途
- lo.wikipedia.org上的用途
- lt.wikipedia.org上的用途
- mk.wikipedia.org上的用途
- ml.wikipedia.org上的用途
- my.wikipedia.org上的用途
- ne.wikipedia.org上的用途
- new.wikipedia.org上的用途
- pa.wikipedia.org上的用途
- ps.wikipedia.org上的用途
- pt.wikipedia.org上的用途
- ru.wikipedia.org上的用途
- sl.wikipedia.org上的用途
- sr.wikipedia.org上的用途
- sr.wikiquote.org上的用途
- te.wikipedia.org上的用途
- tr.wikipedia.org上的用途
- tt.wikipedia.org上的用途
- uk.wikipedia.org上的用途
- vec.wikipedia.org上的用途
- vi.wikipedia.org上的用途
- www.wikidata.org上的用途
- zh-min-nan.wikipedia.org上的用途