File:Geometric cdf.svg

此SVG文件的PNG预览的大小:675 × 288像素。 其他分辨率:320 × 137像素 | 640 × 273像素 | 1,024 × 437像素 | 1,280 × 546像素 | 2,560 × 1,092像素。
原始文件 (SVG文件,尺寸为675 × 288像素,文件大小:116 KB)
摘要
| 描述 |
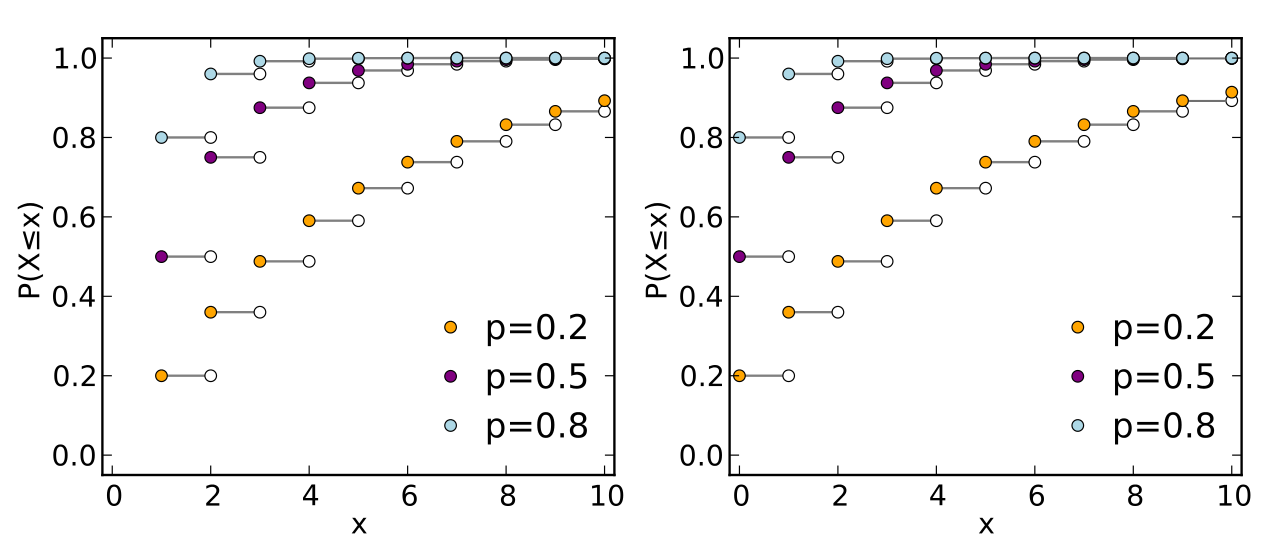
English: Plots of the cumulative distribution functions for several members of the geometric family of probability distributions. |
| 日期 | |
| 来源 |
自己的作品 |
| 作者 | Skbkekas |
| SVG开发 | 本矢量图使用Matplotlib创作。 |
| 源代码 | Python codeimport numpy as np
import matplotlib.pyplot as plt
import scipy.special as sp
col = {0.2: 'orange', 0.5: 'purple', 0.8: 'lightblue'}
plt.clf()
plt.figure(figsize=(7.5,3.2))
ax1 = plt.axes([0.08,0.13,0.4,0.8])
ax2 = plt.axes([0.57,0.13,0.4,0.8])
plt.hold(True)
X1 = np.arange(1,11)
X2 = np.arange(0,11)
ms = 4.9
A1,A2 = [],[]
for p in 0.2,0.5,0.8:
Y1 = 1 - (1-p)**X1
Y2 = 1 - (1-p)**(X2+1)
for k in range(len(Y1)-1):
ax1.plot([X1[k],X1[k]+1], [Y1[k],Y1[k]], '-', color='grey')
ax2.plot([X2[k],X2[k]+1], [Y2[k],Y2[k]], '-', color='grey')
ax1.plot(X1[1:], Y1[:-1], 'o', mec='k', mfc='w', ms=ms)
ax2.plot(X2[1:], Y2[:-1], 'o', mec='k', mfc='w', ms=ms)
a1 = ax1.plot(X1, Y1, 'o', color=col[p], ms=ms)
a2 = ax2.plot(X2, Y2, 'o', color=col[p], ms=ms)
A1.append(a1)
A2.append(a2)
ax1.set_xlabel("x")
ax1.set_ylabel(u"P(X\N{Less-THAN OR EQUAL TO}x)")
ax2.set_xlabel("x")
ax2.set_ylabel(u"P(X\N{Less-THAN OR EQUAL TO}x)")
bx1 = ax1.legend(A1, ("p=0.2", "p=0.5", "p=0.8"),\
numpoints=1, handletextpad=0, loc="lower right")
bx2 = ax2.legend(A2, ("p=0.2", "p=0.5", "p=0.8"),\
numpoints=1, handletextpad=0, loc="lower right")
bx1.draw_frame(False)
bx2.draw_frame(False)
ax1.set_xlim(-0.2,10.2)
ax2.set_xlim(-0.2,10.2)
ax1.set_ylim(-0.05,1.05)
ax2.set_ylim(-0.05,1.05)
plt.savefig("geometric_cdf.pdf")
plt.savefig("geometric_cdf.svg")
|
许可协议
我,本作品著作权人,特此采用以下许可协议发表本作品:
本文件采用知识共享署名 3.0 未本地化版本许可协议授权。
- 您可以自由地:
- 共享 – 复制、发行并传播本作品
- 修改 – 改编作品
- 惟须遵守下列条件:
- 署名 – 您必须对作品进行署名,提供授权条款的链接,并说明是否对原始内容进行了更改。您可以用任何合理的方式来署名,但不得以任何方式表明许可人认可您或您的使用。
文件历史
点击某个日期/时间查看对应时刻的文件。
| 日期/时间 | 缩略图 | 大小 | 用户 | 备注 | |
|---|---|---|---|---|---|
| 当前 | 2013年5月1日 (三) 21:26 | | 675 × 288(116 KB) | Dicklyon | Paint in the missing strokes in upper right part of right plot. |
| 2010年3月1日 (一) 00:34 |  | 675 × 288(76 KB) | Skbkekas | Add open circles to make it clear that it is right continuous. | |
| 2010年2月26日 (五) 23:32 |  | 675 × 288(64 KB) | Skbkekas | {{Information |Description={{en|1=Plots of the cumulative distribution functions for several members of the geometric family of probability distributions.}} |Source={{own}} |Author=Skbkekas |Date=2010-02-26 |Permission= |other_versions= |
文件用途
以下页面使用本文件:
全域文件用途
以下其他wiki使用此文件:
- be.wikipedia.org上的用途
- ca.wikipedia.org上的用途
- en.wikipedia.org上的用途
- en.wikibooks.org上的用途
- ja.wikipedia.org上的用途
- pl.wikipedia.org上的用途
- tr.wikipedia.org上的用途
- uk.wikipedia.org上的用途