File:Health Insurance Coverage in the U.S. 2016 - v1.png
本预览的尺寸:800 × 453像素。 其他分辨率:320 × 181像素 | 640 × 362像素 | 1,024 × 580像素 | 1,392 × 788像素。
原始文件 (1,392 × 788像素,文件大小:78 KB,MIME类型:image/png)
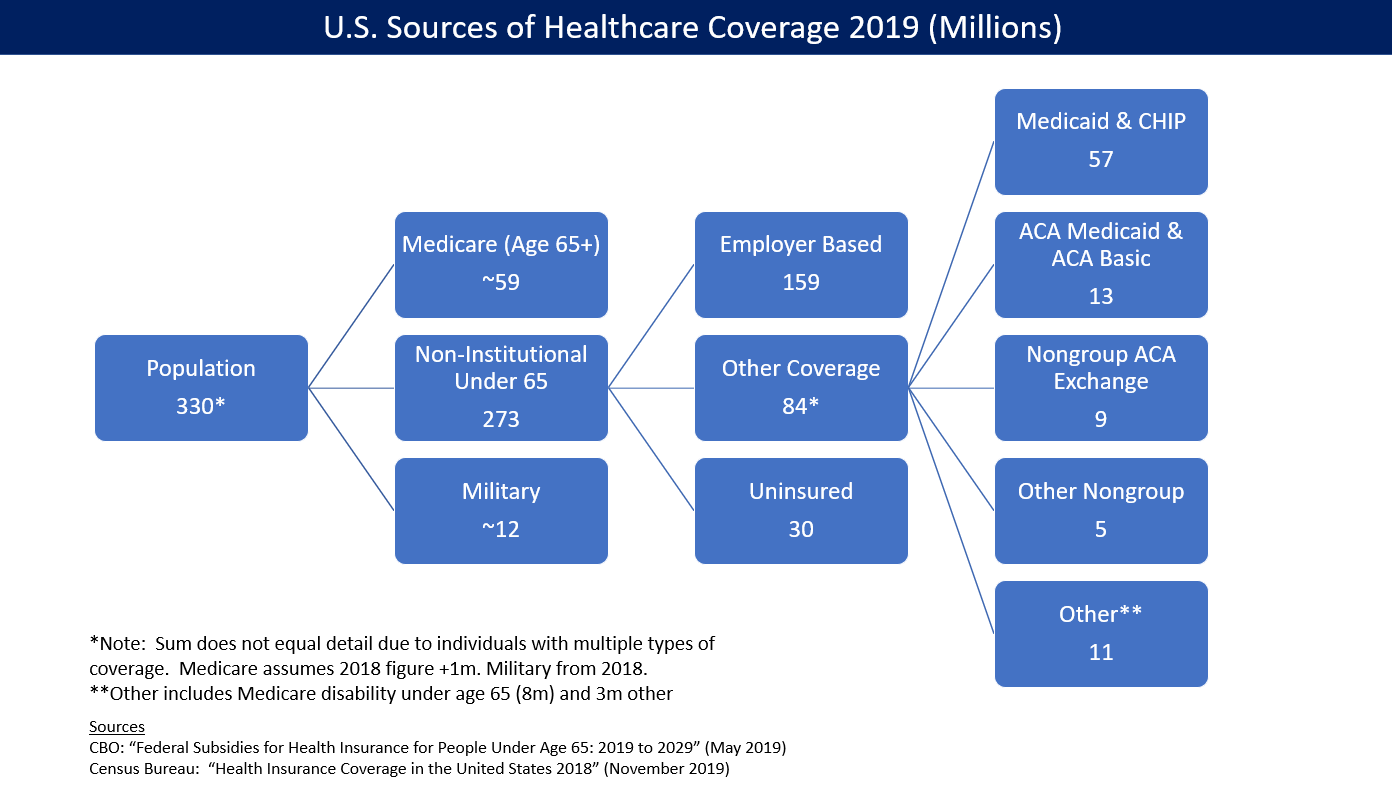
Understanding the chart
The health insurance coverage statistics are made more complex because of persons with multiple forms of coverage (e.g., both employer-provided insurance and Medicaid).
- A primary source for the graphic is from the CBO, which estimated the 2016 amounts for the under 65 group in March 2016.[1]
- The total U.S. population in 2016 was about 324m according to FRED.[2] However, due to the problem with multiple forms of coverage, components in the second layer add up to 340.
- Another source for the Medicare and Military figures is from the Census Bureau.[3]
Neither source presents the complete picture and they are for different time periods, so the diagram should be used as approximations rather than exact portrayal of the figures as of the end of 2016.
摘要
| 描述 |
English: U.S. health insurance coverage by source in 2016. CBO estimated ACA/Obamacare was responsible for 23 million persons covered via exchanges and Medicaid expansion. |
| 日期 | |
| 来源 | 自己的作品 |
| 作者 | Farcaster |
许可协议
我,本作品著作权人,特此采用以下许可协议发表本作品:
本文件采用知识共享署名-相同方式共享 4.0 国际许可协议授权。
- 您可以自由地:
- 共享 – 复制、发行并传播本作品
- 修改 – 改编作品
- 惟须遵守下列条件:
- 署名 – 您必须对作品进行署名,提供授权条款的链接,并说明是否对原始内容进行了更改。您可以用任何合理的方式来署名,但不得以任何方式表明许可人认可您或您的使用。
- 相同方式共享 – 如果您再混合、转换或者基于本作品进行创作,您必须以与原先许可协议相同或相兼容的许可协议分发您贡献的作品。
- ↑ CBO-Federal Subsidies for Health Insurance Coverage for People Under Age 65: 2016 to 2026-March 2016
- ↑ FRED-Total Population
- ↑ Health Insurance Coverage in the United States:2015-Issued September 2016
文件历史
点击某个日期/时间查看对应时刻的文件。
| 日期/时间 | 缩略图 | 大小 | 用户 | 备注 | |
|---|---|---|---|---|---|
| 当前 | 2020年1月10日 (五) 19:42 | | 1,392 × 788(78 KB) | Farcaster | Updated for 2019 |
| 2017年8月25日 (五) 17:21 |  | 1,247 × 704(119 KB) | Farcaster | Updated information | |
| 2017年7月30日 (日) 15:22 |  | 1,238 × 693(172 KB) | Farcaster | User created page with UploadWizard |
文件用途
以下4个页面使用本文件:
全域文件用途
以下其他wiki使用此文件:
- en.wikipedia.org上的用途
- tr.wikipedia.org上的用途
- uz.wikipedia.org上的用途
- vi.wikipedia.org上的用途