File:Hubbert peak oil plot.svg

此SVG文件的PNG预览的大小:600 × 400像素。 其他分辨率:320 × 213像素 | 640 × 427像素 | 1,024 × 683像素 | 1,280 × 853像素 | 2,560 × 1,707像素。
原始文件 (SVG文件,尺寸为600 × 400像素,文件大小:10 KB)
摘要
| 描述 |
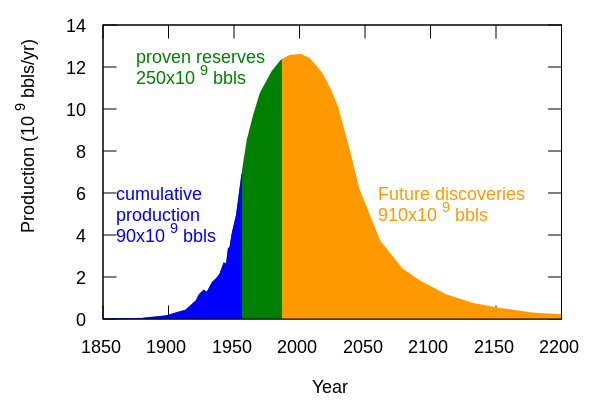
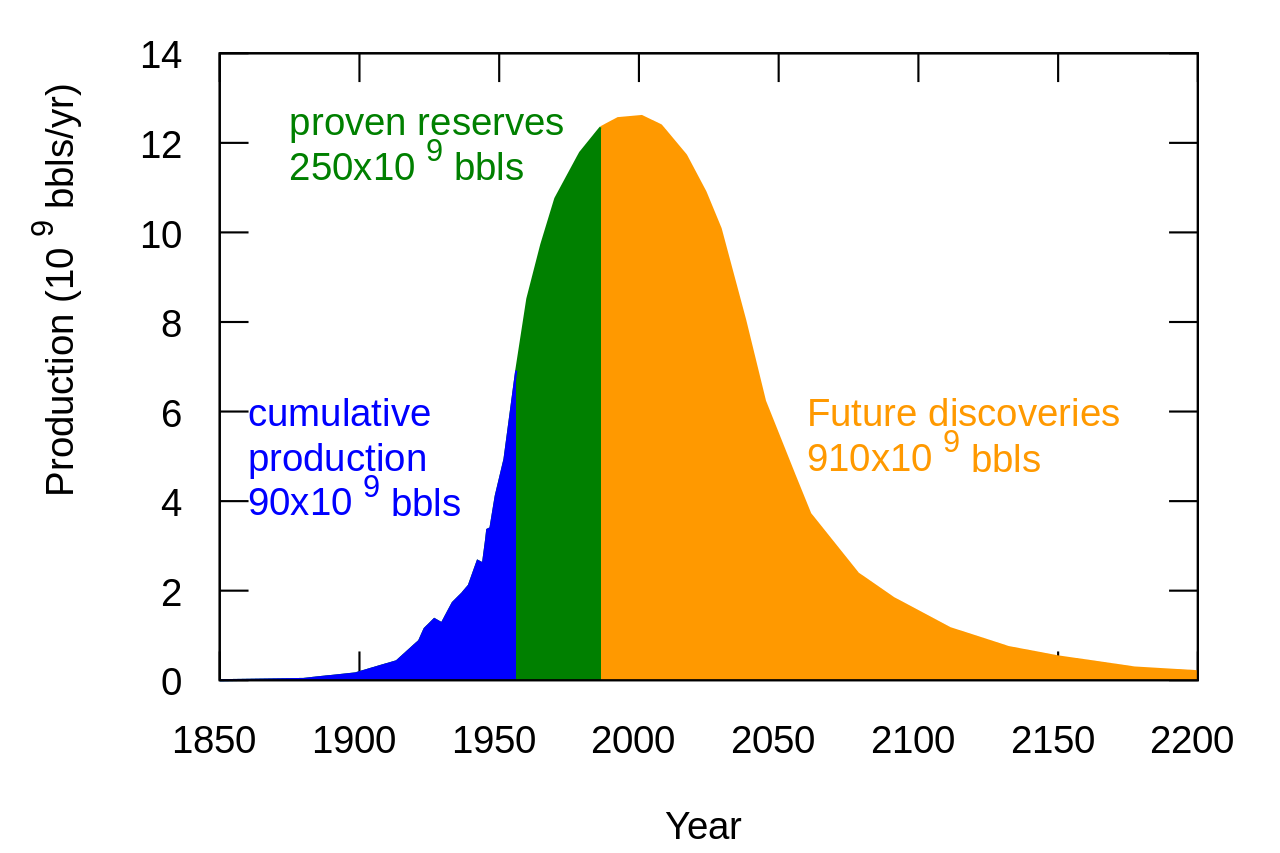
English: New presentation of data in figure 20 of http://www.hubbertpeak.com/hubbert/1956/1956.pdf . Meant as replacement for non-free en:Image:Hubbert-fig-20.png. That ["Hubbert-fig-20.png"] image file -- (well, the "image" part of it) -- has been deleted; but anyone who is interested in seeing what it looked like when it 'did' contain the non-free image (which no longer resides on any "wikimedia dot org" web sites) can [feel free to] see the "archived" copy (as of '20100531145034') (that is, as of May 31, 2010 at 14:50:34), on the Wayback Machine web site at this URL. Just "FYI". |
| 日期 | 2007年3月4日 (原始上传日期) |
| 来源 | 本檔案是由Pline使用CommonsHelper,從en.wikipedia轉移到維基共享資源。 |
| 作者 | 英语维基百科的Hankwang |
| 其他版本 |
|


|
此SVG檔案包含可翻譯至您的語言的内嵌文字,可以使用任何可用SVG編輯器、文本編輯器或SVG翻譯工具來翻譯。詳情請見:關於翻譯SVG檔案。 |
许可协议

|
已授权您依据自由软件基金会发行的无固定段落及封面封底文字(Invariant Sections, Front-Cover Texts, and Back-Cover Texts)的GNU自由文件许可协议1.2版或任意后续版本的条款,复制、传播和/或修改本文件。该协议的副本请见“GNU Free Documentation License”。 |
| 本文件采用知识共享署名-相同方式共享 3.0 未本地化版本许可协议授权。 | ||
| 署名: 英语维基百科的Hankwang | ||
| ||
| 本许可协议标签作为GFDL许可协议更新的组成部分被添加至本文件。 |
您可以选择您需要的许可协议。
Data
Data file "hcurve.dat"
1850 0
1879.97 0.0273319
1898.53 0.150325
1913.26 0.423644
1921.36 0.881453
1923.28 1.14794
1926.76 1.36659
1929.46 1.27093
1933.38 1.72874
1936.78 1.94056
1939.13 2.11822
1942.27 2.66486
1944.19 2.60336
1945.32 3.15
1945.76 3.36182
1946.89 3.39599
1948.81 4.12028
1951.94 4.94024
1956.12 6.91497
1960.04 8.52072
1965.01 9.72332
1970.06 10.7551
1978.95 11.78
1986 12.33  # 12.35
1986.36 12.35  # 12.3608
1992.54 12.55  # 12.6
2001 12.6
2007.97 12.3882
2016.85 11.7254
2023.82 10.9054
2029.23 10.0855
2038.11 8.02191
2045.08 6.23167
2055.54 4.59859
2061.29 3.71714
2078.37 2.38471
2091.09 1.83807
2111.21 1.16844
2132.13 0.744794
2149.81 0.532972
2177.26 0.286985
2200 0.198156
Gnuplot script
set xlab 'Year'
set ylab 'Production (10^9 bbls/yr)    '
set nogrid
unset key

set label 2 'cumulative' at 1860,6  textcolor lt 3
set label 3 'production' at 1860,5  textcolor lt 3
set label 1 '90x10^9 bbls' at 1860,4  textcolor lt 3
set label 4 '250x10^9 bbls' at 1875,11.5  textcolor lt  2
set label 5 'proven reserves' at 1875,12.5  textcolor lt 2
set label 6 'Future discoveries' at 2060,6 textcolor lt 7
set label 7 '910x10^9 bbls' at 2060,5 textcolor lt 7

set term svg size 600 400 fsize 18 enhanced
set outp 'Hubbert_peak_oil_plot.svg'
plot \
  'hcurve.dat' usi ($1>=1986.36?$1:1/0):2 wi filledcurves y1=0 lt 7, \
  'hcurve.dat' usi ($1<=1986.36?$1:1/0):2 wi filledcurves y1=0, \
  'hcurve.dat' usi ($1<1956.5?$1:1/0):2 wi filledcurves y1=0
原始上传日志
原始描述頁面位於這裡。下列使用者名稱均來自en.wikipedia。
- 2007-03-04 12:57 Hankwang 600×400×0 (7794 bytes) New presentation of data in figure 20 of http://www.hubbertpeak.com/hubbert/1956/1956.pdf
文件历史
点击某个日期/时间查看对应时刻的文件。
| 日期/时间 | 缩略图 | 大小 | 用户 | 备注 | |
|---|---|---|---|---|---|
| 当前 | 2009年1月11日 (日) 14:35 | | 600 × 400(10 KB) | Hankwang | Update after comments - Same license as before |
| 2008年6月11日 (三) 16:56 |  | 600 × 400(8 KB) | File Upload Bot (Magnus Manske) | {{BotMoveToCommons|en.wikipedia}} {{Information |Description={{en|New presentation of data in figure 20 of http://www.hubbertpeak.com/hubbert/1956/1956.pdf . Meant as replacement for non-free en::Image:Hubbert-fig-20.png. == Data == Data file "hcu |
文件用途
以下7个页面使用本文件:
全域文件用途
以下其他wiki使用此文件:
- ar.wikipedia.org上的用途
- ca.wikipedia.org上的用途
- de.wikipedia.org上的用途
- el.wikipedia.org上的用途
- en.wikipedia.org上的用途
- Green Revolution
- Simple living
- Energy crisis
- Roscoe Bartlett
- M. King Hubbert
- Vern Ehlers
- Hubbert peak theory
- Kenneth Hsu
- Peak oil
- David Goodstein
- Petroleum politics
- James Howard Kunstler
- Kenneth S. Deffeyes
- Colin Campbell (geologist)
- 2000s energy crisis
- Richard Heinberg
- The End of Suburbia
- The Party's Over: Oil, War, and the Fate of Industrial Societies
- Julian Darley
- Michael Klare
- Matthew Simmons
- The Long Emergency
- Hirsch report
- Oil depletion
- Rimini protocol
- Arctic Refuge drilling controversy
- Oil Shockwave
- Robert L. Hirsch
- Albert Allen Bartlett
- Ali Morteza Samsam Bakhtiari
- Energy supply
- Richard Rainwater
- Jean Laherrère
- The Power of Community: How Cuba Survived Peak Oil
- Andrew McNamara
- Energy descent
- The Carbon War
- Jeremy Leggett
- A Crude Awakening: The Oil Crash
- Oil Depletion Analysis Centre
- User:Kgrr/Sandbox/Peak oil
- Fossil fuel phase-out
- User:Hankwang/Images
- Export Land Model
查看本文件的更多全域用途。