File:Mpl screenshot figures and code.png

本预览的尺寸:752 × 599像素。 其他分辨率:301 × 240像素 | 602 × 480像素 | 964 × 768像素 | 1,227 × 978像素。
原始文件 (1,227 × 978像素,文件大小:350 KB,MIME类型:image/png)
摘要
| 描述 |
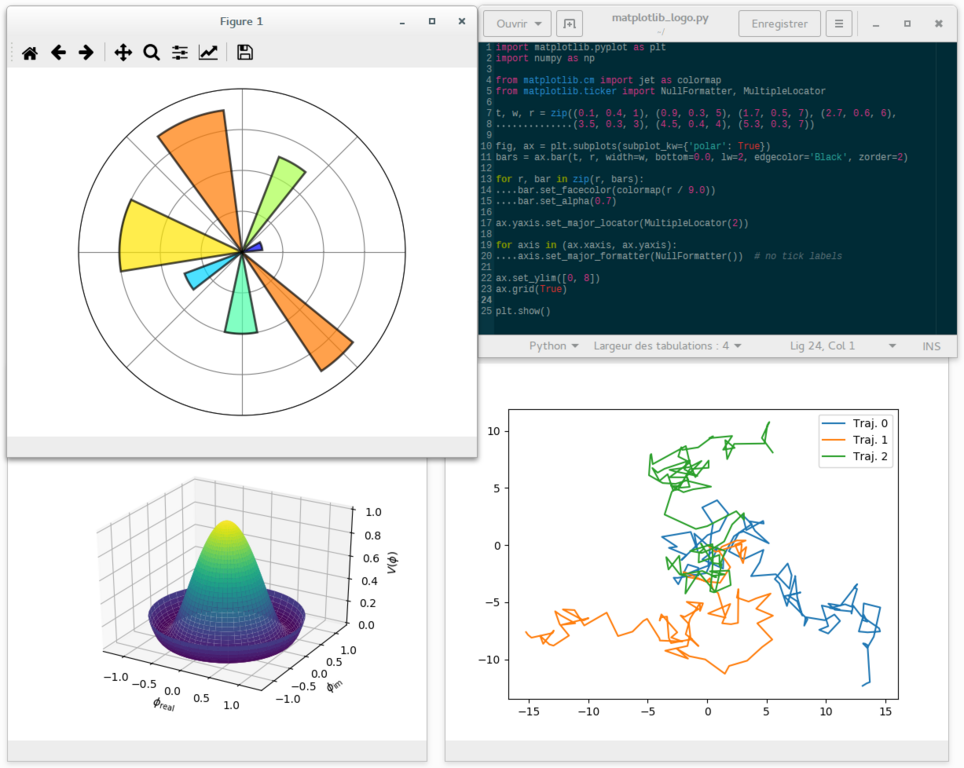
English: A screenshot showing matplotlib plots of a polar bar graph resembling the matplotlib logo (upper left), a 3D surface graph with the new default 'viridis' colormap (lower left), a graph of 2D random walk trajectories (lower right), and the python source code (of the logo part) opened in a text editor (upper right). |
| 日期 | |
| 来源 | 自己的作品 |
| 作者 | Adrien F. Vincent |
Rationale: this work aims at providing an up-to-date version of the previous work https://en.wikipedia.org/wiki/File:Matplotlib_screenshot.png , done by Geek3.
The matplotlib (mpl) version is the development branch 2.x, with Python 2.7.11 and numpy 1.11.1
##########
## Code for the mpl logo figure
##########
import matplotlib.pyplot as plt
import numpy as np

from matplotlib.cm import jet as colormap
from matplotlib.ticker import NullFormatter, MultipleLocator

t, w, r = zip((0.1, 0.4, 1), (0.9, 0.3, 5), (1.7, 0.5, 7), (2.7, 0.6, 6),
              (3.5, 0.3, 3), (4.5, 0.4, 4), (5.3, 0.3, 7))

fig, ax = plt.subplots(subplot_kw={'polar': True})
bars = ax.bar(t, r, width=w, bottom=0.0, lw=2, edgecolor='Black', zorder=2)

for r, bar in zip(r, bars):
    bar.set_facecolor(colormap(r / 9.0))
    bar.set_alpha(0.7)

ax.yaxis.set_major_locator(MultipleLocator(2))

for axis in (ax.xaxis, ax.yaxis):
    axis.set_major_formatter(NullFormatter())  # no tick labels

ax.set_ylim([0, 8])
ax.grid(True)

plt.show()
####################
##########
## Code for the 3D surface plot and the 2D random walk tajectories
##########
import matplotlib.pyplot as plt
import numpy as np

from mpl_toolkits.mplot3d import Axes3D
from matplotlib.cm import viridis as colormap

"""
Figure 1: a 3D surface plot (from matplotlib gallery)
"""
step = 0.04
maxval = 1.0
fig1 = plt.figure("Figure_1")
ax1 = fig1.add_subplot(111, projection='3d')

# Create supporting points in polar coordinates
r = np.linspace(0, 1.2, 50)
p = np.linspace(0, 2*np.pi, 50)
R, P = np.meshgrid(r, p)
# Transform them to cartesian system
X, Y = R*np.cos(P), R*np.sin(P)

Z = ((R**2 - 1)**2)
ax1.plot_surface(X, Y, Z, rstride=1, cstride=1, cmap=colormap)
ax1.set_zlim3d(0, 1)
ax1.set_xlabel(r'$\phi_\mathrm{real}$')
ax1.set_ylabel(r'$\phi_\mathrm{im}$')
ax1.set_zlabel(r'$V(\phi)$')

"""
Figure 2: a few examples of 2D random walk
"""
fig2, ax2 = plt.subplots(num="Figure_2")

prng = np.random.RandomState(123)

x = np.linspace(0, 10, 101)

def random_walk(xy0=(0.0, 0.0), nsteps=100, std=1.0):
    xy = np.zeros((nsteps + 1, 2))
    xy[0,:] = xy0
    deltas = prng.normal(loc=0.0, scale=std, size=(nsteps, 2))
    xy[1:, :] = xy[0, :] + np.cumsum(deltas, axis=0)
    return xy

for cnt in range(3):
    traj = random_walk()
    ax2.plot(traj[:, 0], traj[:, 1], label="Traj. {c}".format(c=cnt))

ax2.legend(loc='best')

plt.show()
####################
许可协议
我,本作品著作权人,特此采用以下许可协议发表本作品:
本文件采用知识共享署名-相同方式共享 4.0 国际许可协议授权。
- 您可以自由地:
- 共享 – 复制、发行并传播本作品
- 修改 – 改编作品
- 惟须遵守下列条件:
- 署名 – 您必须对作品进行署名,提供授权条款的链接,并说明是否对原始内容进行了更改。您可以用任何合理的方式来署名,但不得以任何方式表明许可人认可您或您的使用。
- 相同方式共享 – 如果您再混合、转换或者基于本作品进行创作,您必须以与原先许可协议相同或相兼容的许可协议分发您贡献的作品。
文件历史
点击某个日期/时间查看对应时刻的文件。
| 日期/时间 | 缩略图 | 大小 | 用户 | 备注 | |
|---|---|---|---|---|---|
| 当前 | 2016年9月27日 (二) 09:52 | | 1,227 × 978(350 KB) | Adrien F. Vincent | User created page with UploadWizard |
文件用途
以下页面使用本文件:
全域文件用途
以下其他wiki使用此文件:
- bn.wikipedia.org上的用途
- en.wikipedia.org上的用途
- fr.wikipedia.org上的用途
- hu.wikipedia.org上的用途
- ja.wikipedia.org上的用途
- ko.wikipedia.org上的用途
- pl.wikipedia.org上的用途
- pt.wikipedia.org上的用途
- sr.wikipedia.org上的用途
- tr.wikipedia.org上的用途