File:Photon Cross Sections.png

本预览的尺寸:800 × 581像素。 其他分辨率:320 × 232像素 | 640 × 465像素 | 1,024 × 743像素 | 1,280 × 929像素。
原始文件 (1,280 × 929像素,文件大小:55 KB,MIME类型:image/png)
摘要
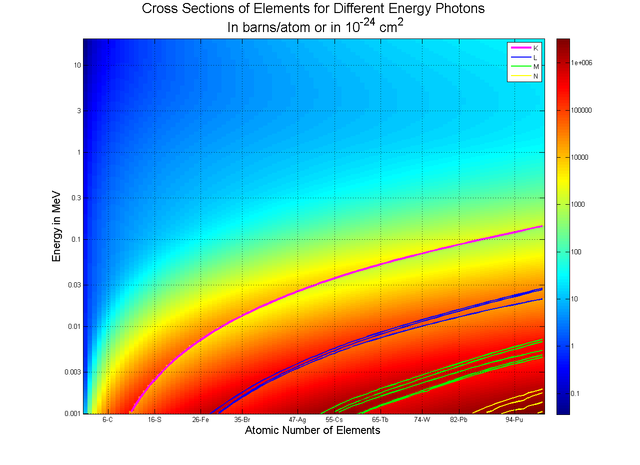
| 描述 | Cross-sections for photons in energy range from 1 keV to 20 MeV for Elements Z = 1 to 100. Based on [1]. Also shown are locations of photons absorption edges (and not Compton edges as mentioned in the comments from the Matlab code). |
| 日期 | |
| 来源 | 自己的作品 |
| 作者 | Jarekt |
The image was generated using the following MATLAB code, with help of external library PhotonAtenuattion2:
figure
Z = 1:100; % elements with Z in 1-100 range
E = logspace(log10(0.001), log10(20), 500);  % define energy grid
X = PhotonAttenuation(Z, E, 'cross section');
colormap(jet(128)) % use hi-res color palette
imagesc(log10(X));
grid on;
axis xy; % put small numbers on y axis on the bottom
title({'Cross Sections of Elements for Different Energy Photons',...
       ' In barns/atom or in 10^{-24} cm^2'});
xlabel('Atomic Number of Elements');
ylabel('Energy in MeV');
% Add X-Axis
EPos = [6 16 26 35 47 55 65 74 82 94];   % define array to store label location
ELab = { '6-C','16-S','26-Fe','35-Br','47-Ag','55-Cs','65-Tb','74-W','82-Pb','94-Pu'}; %Define Energy labels for y-axis
set(gca,'XTick'     ,EPos);
set(gca,'XTickLabel',ELab);
% Add Y-Axis
ELab = [0.001 0.003 0.01 0.03 0.1 0.3 1 3 10]; %Define Energy labels for y-axis
EPos = size(ELab);   % define array to store label location
for i=1:length(ELab), [tmp EPos(i)]=min(abs(E-ELab(i))); end
set(gca,'YTick'     ,EPos);
set(gca,'YTickLabel',ELab);
% add Colorbar
cbar_axes = colorbar;
set(cbar_axes,'YTick'     ,     -1:6 ); % The image is a log10 of the MAC ...
set(cbar_axes,'YTickLabel',10.^(-1:6)); % ... so add proper labels
hold on
% Add Conpton Edges to the plot
[tmp, CEdge] = PhotonAttenuationQ(Z, E);
ed = accumarray([CEdge(:,1),CEdge(:,2)],CEdge(:,3)); % get per element energies of 14 compton edges
ed = 500*(log(ed')-log(0.001))/(log(20)-log(0.001)); % convert energy to row numbers of the image
K=plot(ed(:,1)    ,'m','LineWidth',3); %Plot K Compton edge
L=plot(ed(:, 2: 4),'b','LineWidth',2); %Plot 3 L Compton edges
M=plot(ed(:, 5: 9),'g','LineWidth',2); %Plot 5 M Compton edges
N=plot(ed(:,10:end),'y','LineWidth',2); %Plot first 5 N Compton edges
legend([K(1),L(1),M(1),N(1)], {'K','L','M','N'}, 'Location', 'NorthEast');

|
此graph图片可使用矢量图形重新创建为SVG文件。这具有很多好处;更多信息请参见共享资源:待清理媒体。如果存在此图片的SVG格式,请将其上传,然后将此模板替换为
{{vector version available|新图片名称}}。
建议您将SVG命名为“Photon Cross Sections.svg”,这样在使用Vector version available(或Vva)模板时就不需要填写新图片名称参数。 |
许可协议
我,本作品著作权人,特此采用以下许可协议发表本作品:

|
已授权您依据自由软件基金会发行的无固定段落及封面封底文字(Invariant Sections, Front-Cover Texts, and Back-Cover Texts)的GNU自由文件许可协议1.2版或任意后续版本的条款,复制、传播和/或修改本文件。该协议的副本请见“GNU Free Documentation License”。 |
- 您可以自由地:
- 共享 – 复制、发行并传播本作品
- 修改 – 改编作品
- 惟须遵守下列条件:
- 署名 – 您必须对作品进行署名,提供授权条款的链接,并说明是否对原始内容进行了更改。您可以用任何合理的方式来署名,但不得以任何方式表明许可人认可您或您的使用。
- 相同方式共享 – 如果您再混合、转换或者基于本作品进行创作,您必须以与原先许可协议相同或相兼容的许可协议分发您贡献的作品。
您可以选择您需要的许可协议。
文件历史
点击某个日期/时间查看对应时刻的文件。
| 日期/时间 | 缩略图 | 大小 | 用户 | 备注 | |
|---|---|---|---|---|---|
| 当前 | 2007年9月27日 (四) 03:28 | | 1,280 × 929(55 KB) | Jarekt | {{Information |Description='''Cross-sections''' for photons in energy range from 1 keV to 20 MeV for Elements Z = 1 to 100. Based on [http://physics.nist.gov/PhysRefData/XrayNoteB.html]. Also shown are locations of Compton edges. |Source=self-made |Date=9 |
文件用途
以下页面使用本文件:
全域文件用途
以下其他wiki使用此文件:
- ar.wikipedia.org上的用途
- en.wikipedia.org上的用途
- vi.wikipedia.org上的用途