File:Population densities in Spain (2007).svg

此SVG文件的PNG预览的大小:568 × 387像素。 其他分辨率:320 × 218像素 | 640 × 436像素 | 1,024 × 698像素 | 1,280 × 872像素 | 2,560 × 1,744像素。
原始文件 (SVG文件,尺寸为568 × 387像素,文件大小:1.5 MB)
.svg?uselang=zh)
.svg?uselang=zh)
.svg?action=history&uselang=zh)
.svg)
摘要
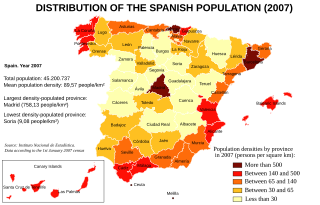
| 描述 | Map of Spain showing the population densities by province, according to the 1st January 2007 Instituto Nacional de Estadística census. |
| 日期 | |
| 来源 | Instituto Nacional de Estadística de España [1]. |
| 作者 | Created by Rodriguillo, from Image:Provinces of Spain.svg, created by Emilio Gómez Fernández |
| 其他版本 | Image:Densidades de población en España (2007).svg (in Spanish) |
.svg)
许可协议
| 本作品已被作者Rodriguillo释出到公有领域。这适用于全世界。 在一些国家这可能不合法;如果是这样的话,那么: |
文件历史
点击某个日期/时间查看对应时刻的文件。
| 日期/时间 | 缩略图 | 大小 | 用户 | 备注 | |
|---|---|---|---|---|---|
| 当前 | 2008年2月6日 (三) 16:29 | | 568 × 387(1.5 MB) | Rodriguillo | == Summary == {{Information |Description= Map of Spain showing the population densities by province, according to the 1st January 2007 ''Instituto Nacional de Estadística'' census. |Source= Instituto Nacional de Estadística de España [http://www.ine.e |
文件用途
以下页面使用本文件:
全域文件用途
以下其他wiki使用此文件:
- af.wikipedia.org上的用途
- bg.wikipedia.org上的用途
- cs.wikipedia.org上的用途
- en.wikipedia.org上的用途
.svg)