File:Power factor 0.7.svg

此SVG文件的PNG预览的大小:669 × 559像素。 其他分辨率:287 × 240像素 | 575 × 480像素 | 919 × 768像素 | 1,226 × 1,024像素 | 2,451 × 2,048像素。
原始文件 (SVG文件,尺寸为669 × 559像素,文件大小:25 KB)
摘要
| 描述 |
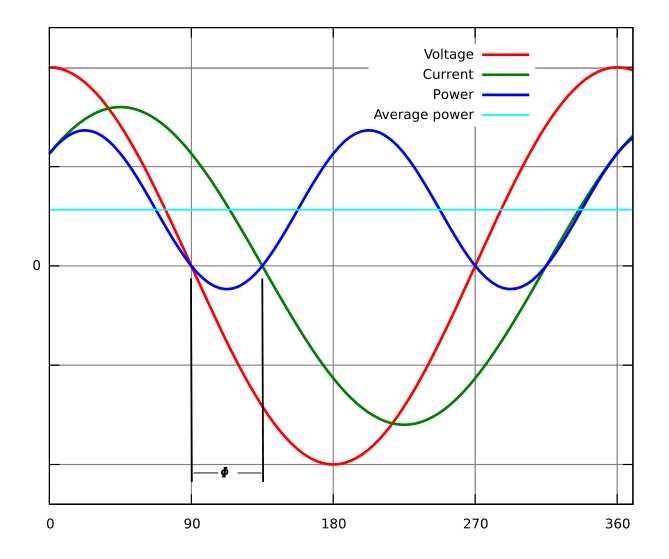
English: An illustration for power factor, showing the voltage, current, and instantaneous power waveforms along with the average power, over a full cycle, when the current lags voltage by 45°. The curve labels in the key are in descending order by peak value.
Русский: Коэффициент мощности при |
| 日期 | |
| 来源 | self-made, after w:Image:ACPower01CJC.png by User:C J Cowie |
| 作者 | 121a0012 |
| 其他版本 |
|


|
此SVG檔案包含可翻譯至您的語言的内嵌文字,可以使用任何可用SVG編輯器、文本編輯器或SVG翻譯工具來翻譯。詳情請見:關於翻譯SVG檔案。 |
This graph was created using Gnuplot 4.2 and then edited with Inkscape. The gnuplot command used to generate the original graph was:
plot \
   cos(x) title "Voltage", \
   0.8*cos(x-45) title "Current", \
   0.8*cos(x)*cos(x-45) title "Power", \
   0.2*sqrt(2) title "Average power"
许可协议
| 此作品不具有版权,属于公有领域,因为其所包含之内容均为公共财产且没有明确的原始作者信息。 如果此图片超出原创性门槛的话,那么作为版权所有者,允许基于以下条件使用该图片:
{{PD-self}}
|
文件历史
点击某个日期/时间查看对应时刻的文件。
| 日期/时间 | 缩略图 | 大小 | 用户 | 备注 | |
|---|---|---|---|---|---|
| 当前 | 2007年10月6日 (六) 02:17 | | 669 × 559(25 KB) | 121a0012 | {{Information |Description=An illustration for power factor, showing the voltage, current, and instantaneous power waveforms along with the average power, over a full cycle, when the power factor is unity (pure resistive load) |Source=s |
文件用途
全域文件用途
以下其他wiki使用此文件:
- bn.wikipedia.org上的用途
- en.wikipedia.org上的用途
- fa.wikipedia.org上的用途
- hi.wikipedia.org上的用途
- ms.wikipedia.org上的用途
- sk.wikipedia.org上的用途
- sr.wikipedia.org上的用途
- su.wikipedia.org上的用途
- tr.wikipedia.org上的用途
- uk.wikipedia.org上的用途