File:TED Spread Chart - Data 2008 zh-hant.svg

原始文件 (SVG文件,尺寸为1,028 × 720像素,文件大小:169 KB)
摘要
| 描述 |
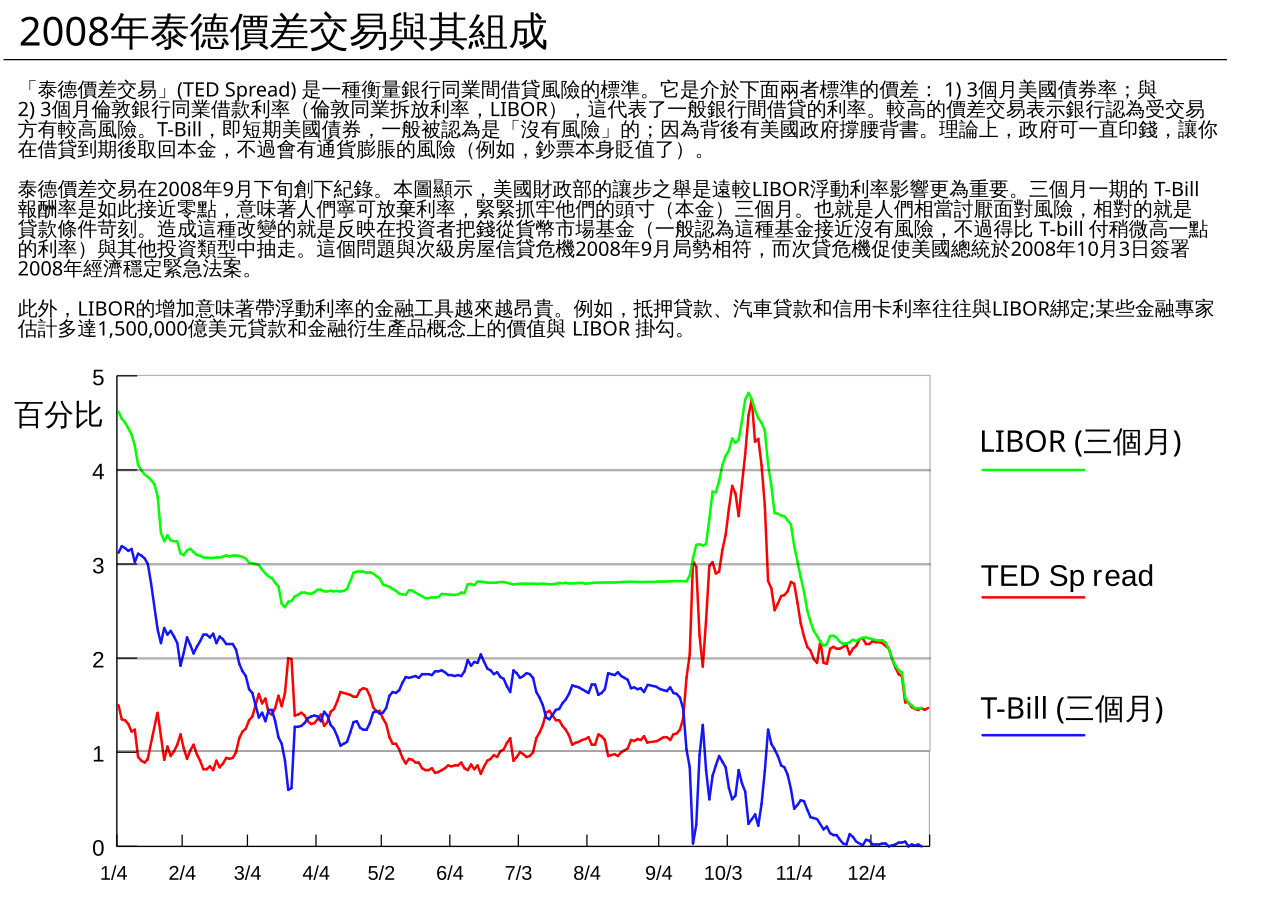
English: The “TED Spread” is a measure of credit risk for inter-bank lending. It is the difference between: 1) the three-month U.S. treasury bill rate; and 2) the three-month London Interbank Borrowing Rate (LIBOR), which represents the rate at which banks typically lend to each other. A higher spread indicates banks perceive each other as riskier counterparties. The t-bill is considered "risk-free" because the full faith and credit of the U.S. government is behind it; theoretically, the government could just print money so you will get your principal back at maturity, although there is risk of inflation (e.g., being paid back in cheaper dollars).
The TED Spread reached record levels in late September 2008. The diagram indicates that the Treasury yield movement was a more significant driver than the changes in LIBOR. A three month t-bill yield so close to zero means that people are willing to forego interest just to keep their money (principal) safe for three months--a very high level of risk aversion and indicative of tight lending conditions. Driving this change were investors shifting funds from money market funds (generally considered nearly risk free but paying a slightly higher rate of return than t-bills) and other investment types.[1] These issues are consistent with the September 2008 aspects of the subprime mortgage crisis which prompted the Emergency Economic Stabilization Act of 2008 signed into law by the U.S. President on October 3, 2008. In addition, an increase in LIBOR means that financial instruments with variable interest terms are increasingly expensive. For example, mortgages, car loans and credit card interest rates are often tied to LIBOR; some estimate as much as $150 trillion in loans and derivative notional value are tied to LIBOR.[2] |
| 日期 | Original date: October 4 2008; Upload date: January 19, 2009 |
| 来源 | en:File:TED Spread Chart - Data to 9 26 08.png |
| 作者 | Origin work by en:User:Farcaster; Chinese Translation by Zanhsieh |
| 其他版本 | en:File:TED Spread Chart - Data to 9 26 08.png |
References
Sources
Three month treasury bill rates: St. Louis Federal Reserve Bank
Three month Libor rates: Bulgarian National Bank Tables
Another libor source: BBA
许可协议
- 您可以自由地:
- 共享 – 复制、发行并传播本作品
- 修改 – 改编作品
- 惟须遵守下列条件:
- 署名 – 您必须对作品进行署名,提供授权条款的链接,并说明是否对原始内容进行了更改。您可以用任何合理的方式来署名,但不得以任何方式表明许可人认可您或您的使用。
- 相同方式共享 – 如果您再混合、转换或者基于本作品进行创作,您必须以与原先许可协议相同或相兼容的许可协议分发您贡献的作品。
文件历史
点击某个日期/时间查看对应时刻的文件。
| 日期/时间 | 缩略图 | 大小 | 用户 | 备注 | |
|---|---|---|---|---|---|
| 当前 | 2009年1月27日 (二) 23:33 | | 1,028 × 720(169 KB) | Zanhsieh | {{Information |Description={{en|1=The “TED Spread” is a measure of credit risk for inter-bank lending. It is the difference between: 1) the three-month U.S. treasury bill rate; and 2) the three-month London Interbank Borrowing Rate (LIBOR), which repr |
| 2009年1月20日 (二) 05:41 |  | 1,028 × 720(163 KB) | Zanhsieh | {{Information |Description={{en|1=The “TED Spread” is a measure of credit risk for inter-bank lending. It is the difference between: 1) the three-month U.S. treasury bill rate; and 2) the three-month London Interbank Borrowing Rate (LIBOR), which repr |
文件用途
以下页面使用本文件: