File:T distribution 30df enhanced.svg

此SVG文件的PNG预览的大小:360 × 360像素。 其他分辨率:240 × 240像素 | 480 × 480像素 | 768 × 768像素 | 1,024 × 1,024像素 | 2,048 × 2,048像素。
原始文件 (SVG文件,尺寸为360 × 360像素,文件大小:67 KB)
摘要
| 描述 |
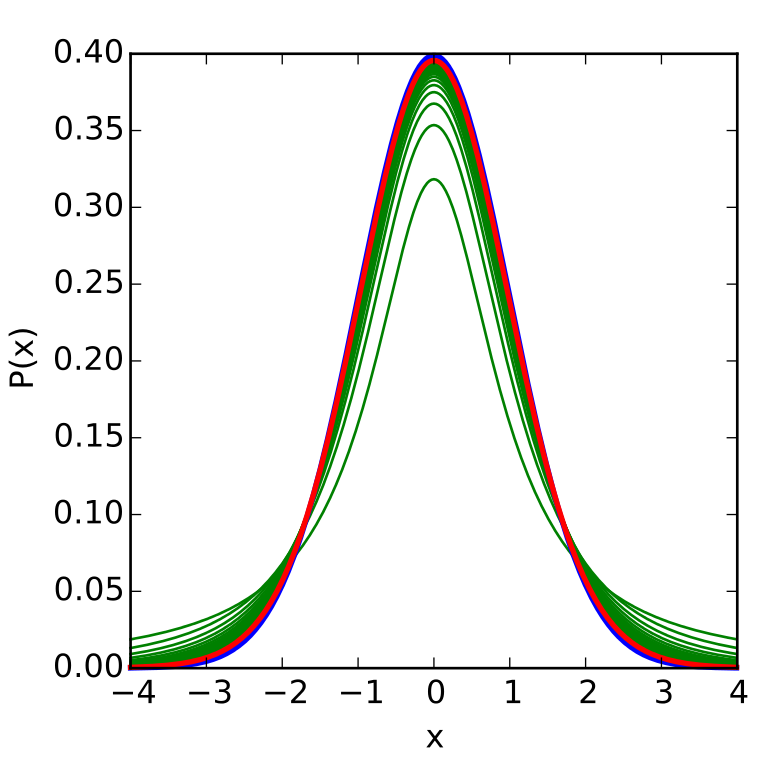
English: Student's t-distribution with 30 degrees of freedom. Enhanced imaging |
| 日期 | |
| 来源 | 自己的作品 |
| 作者 | IkamusumeFan |
| SVG开发 |
Plot using Python Matplotlib.
许可协议
我,本作品著作权人,特此采用以下许可协议发表本作品:
本文件采用知识共享署名-相同方式共享 3.0 未本地化版本许可协议授权。
- 您可以自由地:
- 共享 – 复制、发行并传播本作品
- 修改 – 改编作品
- 惟须遵守下列条件:
- 署名 – 您必须对作品进行署名,提供授权条款的链接,并说明是否对原始内容进行了更改。您可以用任何合理的方式来署名,但不得以任何方式表明许可人认可您或您的使用。
- 相同方式共享 – 如果您再混合、转换或者基于本作品进行创作,您必须以与原先许可协议相同或相兼容的许可协议分发您贡献的作品。
Python (Matplotlib)
import numpy as np
import matplotlib.pyplot as plt
import scipy.special as sp

X = np.arange(-4, 4, 0.01)	# range of the graph

plt.clf()
plt.figure(figsize=(4,4))
plt.axes([0.17,0.13,0.79,0.8])
plt.hold(True)

Q = []	# No curves at first.

# Draw the previous Student's t-distributions
nu = 30	# freedom degree = 30
for previous_nu in range(1,nu):
	mu = 0	# mean = 0
	A = np.exp(sp.gammaln((previous_nu+1)/2.0));
	B = np.exp(sp.gammaln(previous_nu/2.0))*np.sqrt(previous_nu*np.pi);
	C = (1+X*X/previous_nu)**(-(previous_nu+1)/2.0);
	Y = A*C/B;
	a = plt.plot(X, Y, '-', color='green', lw=1)
	Q.append(a)

# Draw the curve of Normal distribution
mu = 0	# mean = 0
sigma = 1	# variance = 1
A = 1/(sigma*np.sqrt(2*np.pi))
B = np.exp(-(X-mu)*(X-mu)/(2*sigma*sigma));
Y = A*B
a = plt.plot(X, Y, '-', color='blue', lw=2)
Q.append(a)

# Draw the curve of Student's t-distribution
mu = 0	# mean = 0
A = np.exp(sp.gammaln((nu+1)/2.0));
B = np.exp(sp.gammaln(nu/2.0))*np.sqrt(nu*np.pi);
C = (1+X*X/nu)**(-(nu+1)/2.0);
Y = A*C/B;
a = plt.plot(X, Y, '-', color='red', lw=2)
Q.append(a)

# Remaining steps to finish drawing the graph.
plt.xlabel("x")
plt.ylabel("P(x)")
plt.xlim(-4,4)

# Saving the output.
plt.savefig("T_distribution_1df.pdf")
plt.savefig("T_distribution_1df.eps")
plt.savefig("T_distribution_1df.svg")
文件历史
点击某个日期/时间查看对应时刻的文件。
| 日期/时间 | 缩略图 | 大小 | 用户 | 备注 | |
|---|---|---|---|---|---|
| 当前 | 2016年4月29日 (五) 09:10 | | 360 × 360(67 KB) | IkamusumeFan | revise based on discussions |
| 2013年7月21日 (日) 04:55 |  | 360 × 360(86 KB) | IkamusumeFan | The previous edition is wrong on the degrees of freedom. | |
| 2013年7月21日 (日) 04:26 |  | 360 × 360(86 KB) | IkamusumeFan | Thicker lines for visibility. | |
| 2013年7月21日 (日) 04:16 |  | 360 × 360(86 KB) | IkamusumeFan | User created page with UploadWizard |
文件用途
以下页面使用本文件:
全域文件用途
以下其他wiki使用此文件:
- ca.wikipedia.org上的用途
- el.wikipedia.org上的用途
- en.wikipedia.org上的用途
- ru.wikipedia.org上的用途
- sr.wikipedia.org上的用途