File:Timeline of weekly confirmed COVID-19 deaths in the United States.svg

此SVG文件的PNG预览的大小:800 × 565像素。 其他分辨率:320 × 226像素 | 640 × 452像素 | 1,024 × 723像素 | 1,280 × 904像素 | 2,560 × 1,807像素。
原始文件 (SVG文件,尺寸为850 × 600像素,文件大小:72 KB)
摘要
| 描述 |
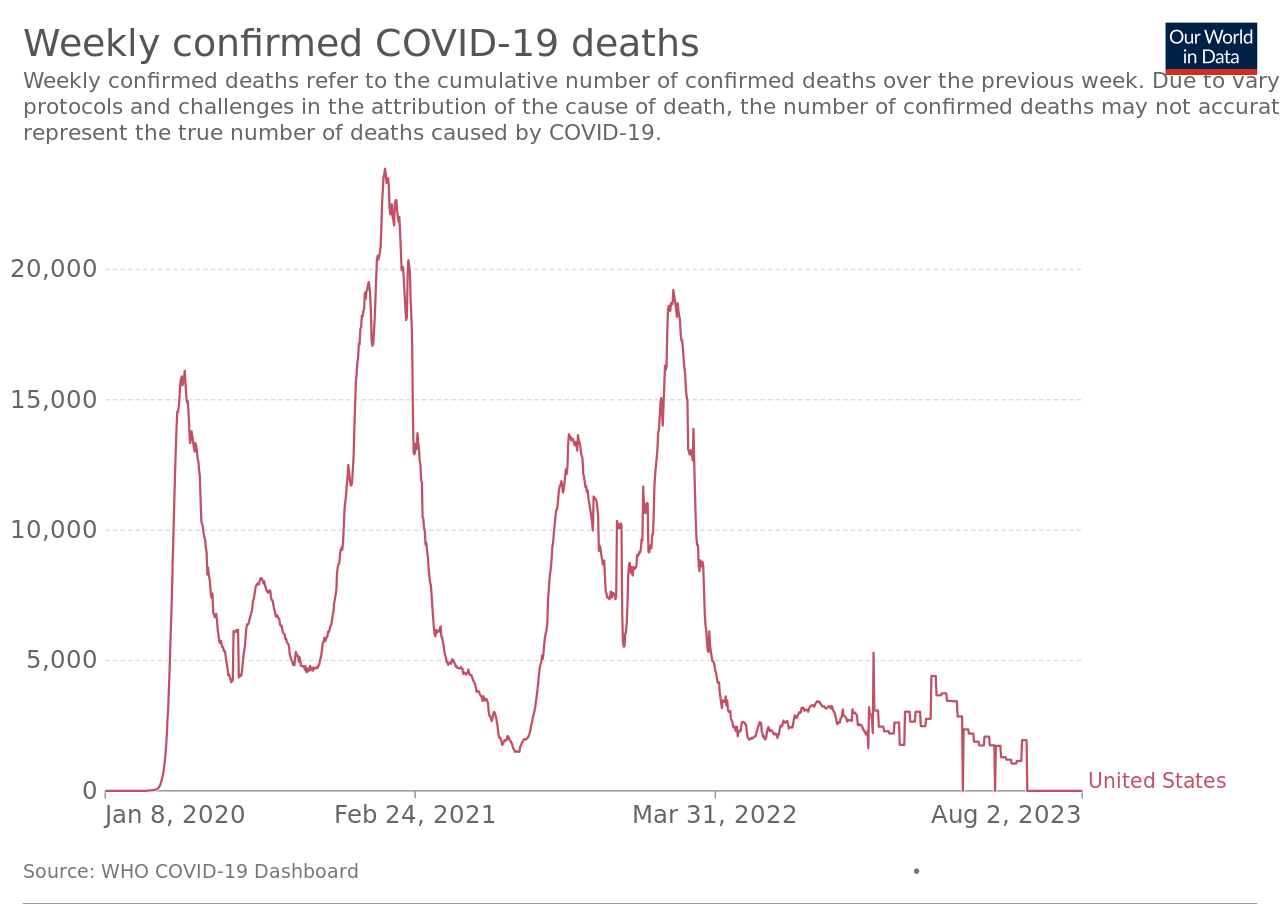
English: Timeline of weekly confirmed COVID-19 deaths in the United States. See end date on graph. Go to the source link below. The graph at the source is interactive and provides more detail. For example, run your cursor over the graph for the date and weekly count. The sources tab there links to: COVID-19 Data Repository by the Center for Systems Science and Engineering (CSSE) at Johns Hopkins University. The table tab has weekly numbers by country. |
| 日期 | is the date of the first upload to the Commons. See the file history below for the most recent upload date. Please upload new versions. Use the upload link at the end of the file history list. |
| 来源 | 个人作品,使用: https://ourworldindata.org/grapher/weekly-covid-deaths?tab=chart&country=~USA - Click on the download tab. |
| 作者 | Our World In Data. See Wikipedia: Our World in Data. |
| SVG开发 |
许可协议
文件历史
点击某个日期/时间查看对应时刻的文件。
| 日期/时间 | 缩略图 | 大小 | 用户 | 备注 | |
|---|---|---|---|---|---|
| 当前 | 2023年8月8日 (二) 21:58 | | 850 × 600(72 KB) | Timeshifter | latest |
| 2023年5月19日 (五) 03:06 |  | 850 × 600(69 KB) | Timeshifter | Latest | |
| 2023年2月12日 (日) 22:58 |  | 850 × 600(63 KB) | Timeshifter | Latest | |
| 2023年1月14日 (六) 04:58 |  | 850 × 600(61 KB) | Timeshifter | Latest graph | |
| 2023年1月5日 (四) 06:55 |  | 850 × 600(61 KB) | Timeshifter | latest graph from source. | |
| 2022年12月11日 (日) 15:08 |  | 850 × 600(60 KB) | Timeshifter | latest graph from source. | |
| 2022年11月21日 (一) 23:54 |  | 850 × 600(60 KB) | Timeshifter | latest graph from source. | |
| 2022年10月23日 (日) 10:31 |  | 850 × 600(58 KB) | Timeshifter | latest graph from source. | |
| 2022年10月6日 (四) 23:40 |  | 850 × 600(58 KB) | Timeshifter | latest graph from source. | |
| 2022年8月23日 (二) 11:24 |  | 850 × 600(56 KB) | Timeshifter | Latest graph from source |
文件用途
以下页面使用本文件:
全域文件用途
以下其他wiki使用此文件:
- en.wikipedia.org上的用途
- ja.wikipedia.org上的用途
- pl.wikipedia.org上的用途