File:Total population living in extreme poverty, by world region (PovcalNet, World Bank (1987 to 2013)), OWID.svg

此SVG文件的PNG预览的大小:800 × 565像素。 其他分辨率:320 × 226像素 | 640 × 452像素 | 1,024 × 723像素 | 1,280 × 904像素 | 2,560 × 1,807像素。
原始文件 (SVG文件,尺寸为850 × 600像素,文件大小:14 KB)
),_OWID.svg?uselang=zh)
),_OWID.svg?uselang=zh)
),_OWID.svg?action=history&uselang=zh)
),_OWID.svg)
摘要
| 描述 |
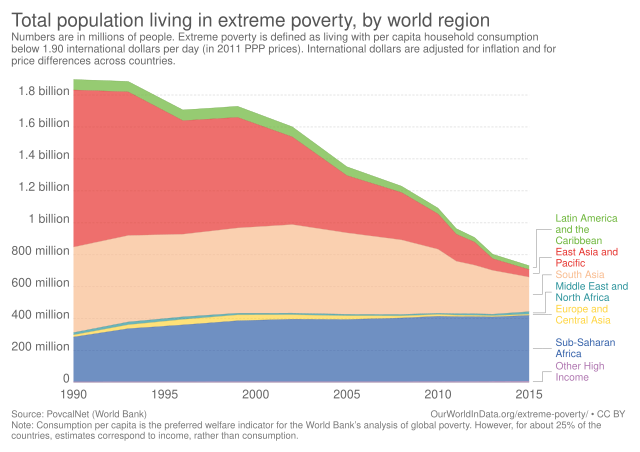
English: :Total population living in extreme poverty, by world region
|
| 日期 | (chart creation) |
| 来源 | https://ourworldindata.org/grapher/total-population-living-in-extreme-poverty-by-world-region |
| 作者 | Our World In Data |
| 授权 (二次使用本文件) |
"License: All of Our World in Data is completely open access and all work is licensed under the Creative Commons BY license. You have the permission to use, distribute, and reproduce in any medium, provided the source and authors are credited." |
许可协议
本文件采用知识共享署名 3.0 未本地化版本许可协议授权。
- 您可以自由地:
- 共享 – 复制、发行并传播本作品
- 修改 – 改编作品
- 惟须遵守下列条件:
- 署名 – 您必须对作品进行署名,提供授权条款的链接,并说明是否对原始内容进行了更改。您可以用任何合理的方式来署名,但不得以任何方式表明许可人认可您或您的使用。
文件历史
点击某个日期/时间查看对应时刻的文件。
| 日期/时间 | 缩略图 | 大小 | 用户 | 备注 | |
|---|---|---|---|---|---|
| 当前 | 2020年2月11日 (二) 21:29 | | 850 × 600(14 KB) | Fæ | OWID project #1338 |
文件用途
以下页面使用本文件:
全域文件用途
以下其他wiki使用此文件:
- ar.wikipedia.org上的用途
- en.wikipedia.org上的用途
- es.wikipedia.org上的用途
- fa.wikipedia.org上的用途
- he.wikipedia.org上的用途
- id.wikipedia.org上的用途
- it.wikipedia.org上的用途
- ja.wikipedia.org上的用途
- mk.wikipedia.org上的用途
- ru.wikipedia.org上的用途
- ta.wikipedia.org上的用途
),_OWID.svg)