File:Vesuvius SRTM3.png
本预览的尺寸:711 × 599像素。 其他分辨率:285 × 240像素 | 570 × 480像素 | 942 × 794像素。
原始文件 (942 × 794像素,文件大小:922 KB,MIME类型:image/png)
摘要
| 描述 |
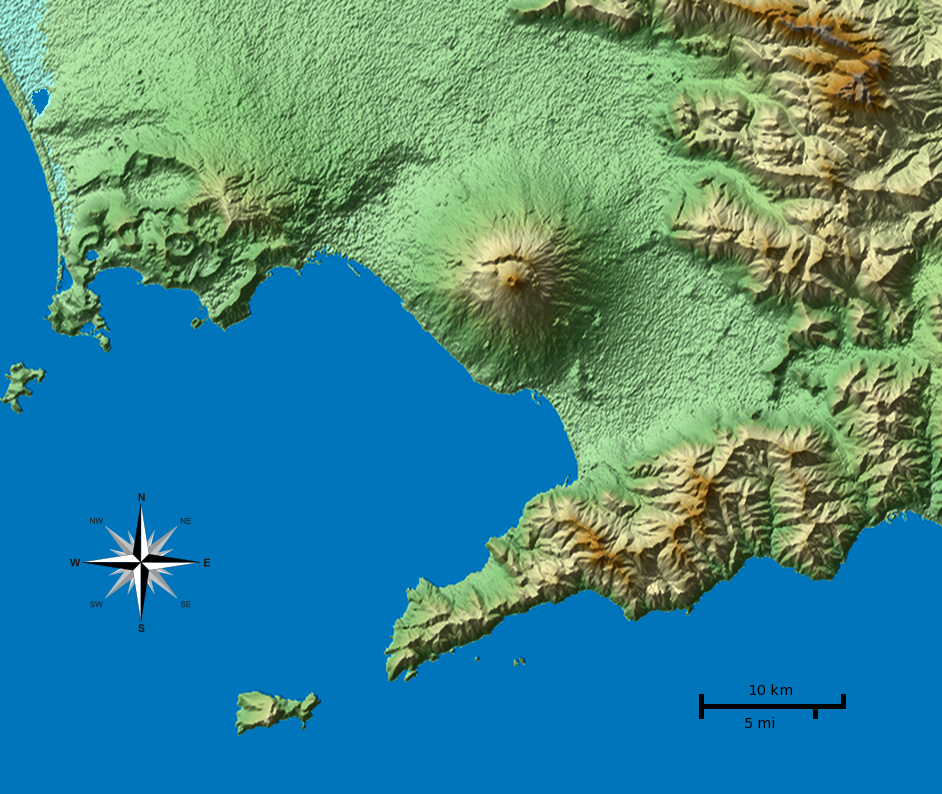
English: Shaded terrain map of the Naples and Mount Vesuvius region from SRTM3 elevation data. Each pixel corresponds to about 70x70 m. SRTM tile used was http://dds.cr.usgs.gov/srtm/version2_1/SRTM3/Eurasia/N40E014.hgt.zip. The top of the image is 41°N, the left side is 14°E.
|
| 日期 | |
| 来源 | 自己的作品 |
| 作者 |
Morn the Gorn compass rose from Maps_template-fr.svg: Eric Gaba (Sting - fr:Sting) |
| 其他版本 |
此文件衍生的作品: 本檔案衍生自: Vesuvius SRTM3.xcf |
Code
SRTM data was plotted with the following Python 2 script (requires Python Imaging Library and NumPy) and then rescaled in Gimp to correct for the raw data aspect ratio at that latitude (about 92 m x 70 m). Terrain shading and hypsometric colors were combined in Gimp in layer multiply mode.
# Read SRTM3 file and create shaded relief

# 2010-04-05

from struct import unpack,calcsize

from numpy import *
import numpy as np
from PIL import Image

row_length = 1201	# row_length is 1201 for SRTM3 or 3601 for SRTM1
file_name  = "N40E014.hgt"	# from http://dds.cr.usgs.gov/srtm/version2_1/SRTM3/Eurasia/
hlim       = 800	# height limit for map [m]

ref_lat    = 40.55	# reference latitude
earth_eq   = 6371. * 1000. * 2. * pi
x_scale    = 1./360.*earth_eq*cos(ref_lat/180.*pi)/row_length
y_scale    = 1./360.*earth_eq/row_length

print "1 pixel = %u * %u m" % (x_scale, y_scale)
print "factor", y_scale/x_scale

h = zeros((row_length, row_length))
f = open(file_name, 'r')
li = []

for j in range(row_length):
	for i in range(row_length):
		d = f.read(2)
		(height,) = unpack('>h', d)
		h[i,j] = height
		if height < -1000:
			li.append((i,j))

hmax = h.max()
h3 = zeros_like(h)
h3[:,:] = h[:,:]
print len(li), "missing data points"

def get_nei(z):
	h2 = h[z[0]-1:z[0]+2,z[1]-1:z[1]+2]
	nn = sum(where(h2 < -1000, 0, 1))
	av = sum(where(h2 > -1000, h2, 0)) / float(nn)
	return nn, av

# fill missing points with a nearest-neighbor averaging method:
loop = len(li)
lim = 7
while loop > 0:
	sd = False
	for q in range(len(li)):
		if h[li[q]] > -1000.: continue
		n, a = get_nei(li[q])
		if n >= lim:
			print li[q],loop, n, a, lim
			h3[li[q]] = a
			loop -= 1
			sd = True
	if not sd: lim -= 1
	h[:,:] = h3[:,:]
print "missing points done"

def hext(a):
	"Hex color to triplet."
	r,g,b = a[0:2], a[2:4], a[4:6]
	return int(r, 16), int(g, 16), int(b, 16)

# from http://en.wikipedia.org/wiki/Wikipedia:WikiProject_Maps/Conventions/Topographic_maps:
col_sea = hext("0978ab")
cols = """
{{Mapcolor|r=245|v=244|b=242|hex=#F5F4F2|col=black}}
{{Mapcolor|r=224|v=222|b=216|hex=#E0DED8|col=black}}
{{Mapcolor|r=202|v=195|b=184|hex=#CAC3B8|col=black}}
{{Mapcolor|r=186|v=174|b=154|hex=#BAAE9A|col=black}}
{{Mapcolor|r=172|v=154|b=124|hex=#AC9A7C|col=black}}
{{Mapcolor|r=170|v=135|b=83|hex=#AA8753|col=black}}
{{Mapcolor|r=185|v=152|b=90|hex=#B9985A|col=black}}
{{Mapcolor|r=195|v=167|b=107|hex=#C3A76B|col=black}}
{{Mapcolor|r=202|v=185|b=130|hex=#CAB982|col=black}}
{{Mapcolor|r=211|v=202|b=157|hex=#D3CA9D|col=black}}
{{Mapcolor|r=222|v=214|b=163|hex=#DED6A3|col=black}}
{{Mapcolor|r=232|v=225|b=182|hex=#E8E1B6|col=black}}
{{Mapcolor|r=239|v=235|b=192|hex=#EFEBC0|col=black}}
{{Mapcolor|r=225|v=228|b=181|hex=#E1E4B5|col=black}}
{{Mapcolor|r=209|v=215|b=171|hex=#D1D7AB|col=black}}
{{Mapcolor|r=189|v=204|b=150|hex=#BDCC96|col=black}}
{{Mapcolor|r=168|v=198|b=143|hex=#A8C68F|col=black}}
{{Mapcolor|r=148|v=191|b=139|hex=#94BF8B|col=black}}
{{Mapcolor|r=172|v=208|b=165|hex=#ACD0A5|col=black}}
"""
col = []

for l in cols.splitlines():
	if len(l) < 10: continue
	i = l.find('#')
	if i > -1:
		col.append(hext(l[i+1:i+7]))

col.reverse()	# -> bottom to top

o = Image.new('RGB', h.shape)

def interp(c, f):
	"Interpolate into color table."
	r = int((1.-f) * col[c][0] + f * col[c+1][0])
	g = int((1.-f) * col[c][1] + f * col[c+1][1])
	b = int((1.-f) * col[c][2] + f * col[c+1][2])
	return r,g,b

for j in range(row_length):
	for i in range(row_length):
		c, f = divmod(h[j,i] / hmax * (len(col)-1), 1)
		if 0 < h[j,i] < hmax:
			o.putpixel((j,i), interp(int(c), f))
		elif h[i,j] == hmax:
			o.putpixel((j,i), col[-1])
		else: o.putpixel((j,i), col_sea)

o.save("map_height.png")	# save height map
o2 = o.crop((0,0,942,603))
o2.save("map_height_cropped.png")

# taken from hillshade.py:
#def illumination(idata,azdeg=315.0,altdeg=45.):
def illumination(idata,azdeg=225.0,altdeg=45.):
    # convert alt, az to radians
    az = azdeg*np.pi/180.0
    alt = altdeg*np.pi/180.0
    # gradient in x and y directions
    dx, dy = np.gradient(idata)
    slope = 0.5*np.pi - np.arctan(np.hypot(dx, dy))
    aspect = np.arctan2(dx, dy)
    odata = np.sin(alt)*np.sin(slope) + np.cos(alt)*np.cos(slope)*np.cos(-az -\
             aspect - 0.5*np.pi)
    # rescale to interval -1,1
    # 1 means maximum sun exposure and 0 means complete shade.
    odata = (odata - odata.min())/(odata.max() - odata.min())
    return odata

il = 255 * illumination(h)

o4 = Image.new('RGBA', il.shape)
for j in range(row_length-1):
	for i in range(row_length-1):
		v = int(il[j,i])
		if 0 <= v < 128:
			alpha = (255 - 2*v)
			o4.putpixel((j,i), (0,0,0,alpha))
		elif v == 128:
			o4.putpixel((j,i), (0,0,0,0))
		elif 128 < v < 256:
			alpha = 2*(v-128)
			o4.putpixel((j,i), (255,255,255,alpha))
		else:
			o4.putpixel((j,i), (255,255,255,0))
o4.save("il_NW_alpha.png")	# NW-illuminated (alpha transparency for use with Inkscape)
许可协议
我,本作品著作权人,特此采用以下许可协议发表本作品:
本文件采用知识共享署名-相同方式共享 3.0 未本地化版本许可协议授权。
- 您可以自由地:
- 共享 – 复制、发行并传播本作品
- 修改 – 改编作品
- 惟须遵守下列条件:
- 署名 – 您必须对作品进行署名,提供授权条款的链接,并说明是否对原始内容进行了更改。您可以用任何合理的方式来署名,但不得以任何方式表明许可人认可您或您的使用。
- 相同方式共享 – 如果您再混合、转换或者基于本作品进行创作,您必须以与原先许可协议相同或相兼容的许可协议分发您贡献的作品。

|
已授权您依据自由软件基金会发行的无固定段落及封面封底文字(Invariant Sections, Front-Cover Texts, and Back-Cover Texts)的GNU自由文件许可协议1.2版或任意后续版本的条款,复制、传播和/或修改本文件。该协议的副本请见“GNU Free Documentation License”。 |
您可以选择您需要的许可协议。
| 註解 | 該圖片含有註解:在維基媒體共享資源上查看註解 |
文件历史
点击某个日期/时间查看对应时刻的文件。
| 日期/时间 | 缩略图 | 大小 | 用户 | 备注 | |
|---|---|---|---|---|---|
| 当前 | 2010年4月5日 (一) 01:01 | | 942 × 794(922 KB) | Morn | corrected color of a lake |
| 2010年4月5日 (一) 00:56 |  | 942 × 794(1.01 MB) | Morn | removed artifacts in shadows | |
| 2010年4月4日 (日) 19:06 |  | 942 × 794(908 KB) | Morn | compass rose | |
| 2010年4月4日 (日) 14:49 |  | 942 × 794(899 KB) | Morn | removed slight banding in the water | |
| 2010年4月4日 (日) 14:41 |  | 942 × 794(904 KB) | Morn | color version | |
| 2010年4月4日 (日) 12:18 |  | 942 × 794(750 KB) | Morn | scale | |
| 2010年4月3日 (六) 20:55 |  | 942 × 794(652 KB) | Morn | {{Information |Description={{en|1=Shaded terrain image of the Naples and Mount Vesuvius region from SRTM3 data. Each pixel corresponds to about 70x70 m.}} |Source={{own}} |Author=Morn the Gorn |Date=2010-03-04 |Permission= |other_ve |
文件用途
以下页面使用本文件:
全域文件用途
以下其他wiki使用此文件:
- ast.wikipedia.org上的用途
- as.wikipedia.org上的用途
- cs.wikipedia.org上的用途
- en.wikipedia.org上的用途
- eo.wikivoyage.org上的用途
- es.wikipedia.org上的用途
- et.wikipedia.org上的用途
- fy.wikipedia.org上的用途
- hu.wikipedia.org上的用途
- hyw.wikipedia.org上的用途
- id.wikipedia.org上的用途
- it.wikipedia.org上的用途
- it.wikibooks.org上的用途
- it.wikiversity.org上的用途
- ja.wikipedia.org上的用途
- ka.wikipedia.org上的用途
- ko.wikipedia.org上的用途
- la.wikipedia.org上的用途
- nl.wikipedia.org上的用途
- nn.wikipedia.org上的用途
- oc.wikipedia.org上的用途
- ro.wikipedia.org上的用途
- simple.wikipedia.org上的用途
- sr.wikipedia.org上的用途
- tl.wikipedia.org上的用途
- tr.wikipedia.org上的用途
- vi.wikipedia.org上的用途