User:ATannedBurger/沙盒/美國國會選區列表
美國國會選區是指由各州所劃出的單塊或多塊人口數約略相同的選區[1]。每一個國會選區只能選出一名眾議員選舉部門對選舉成員的目的。眾議院目前有435個席位[2],每個席位代表約747,000人[3]。
以下是眾議院當前的435個國會區,超過200個裁撤選區以及六個現任和一個裁撤的無表決權代表團的完整列表。
相關紀錄 编辑
- 根據2010年人口普查,美國平均人口為710,767人。2000年為646,946人。
- 平均人口最多的州:蒙大拿州(994,416人)。2000年也是蒙大拿州:905,316人。
- 平均人數最少的州:羅德島(527,624人)。 2000年為懷俄明州:495,304人。
- 人口最多的地區:蒙大拿州單一選區(994,416)。2000年也是蒙大拿州單一選區:905,316。
- 人口最少的區:羅德島第一區(526,283)。 2000年為懷俄明州單一選區:495,304。
阿拉巴馬 编辑

- 領地: 1818–1819 (建州後不再使用)
- 單一選區: 1819–1823, 1841–1843, 1873–1877, 1913–1917, 1963–1965 (不再使用)
- 第1選區: 1823–1841, 1843–1963, 1965–現今
- 第2選區: 1823–1841, 1843–1963, 1965–現今
- 第3選區: 1823–1841, 1843–1963, 1965–現今
- 第4選區: 1833–1841, 1843–1963, 1965–現今
- 第5選區: 1833–1841, 1843–1963, 1965–現今
- 第6選區: 1843–1963, 1965–現今
- 第7選區: 1843–1863, 1877–1963, 1965–現今
- 第8選區: 1877–1963, 1965–1973 (1970年人口普查後不再使用)
- 第9選區: 1893–1963 (1960年人口普查後不再使用)
- 第10選區: 1917–1933 (1930年人口普查後不再使用)
阿拉斯加 编辑

美屬薩摩亞 编辑
見無表決權的選區。
亞利桑那 编辑

阿肯色州 编辑

加利福尼亞州 编辑

- 單一選區: 1849–1865, 1883–1885 (不再使用)
- 第一選區: 1865–現今
- 第二選區: 1865–現今
- 第三選區: 1865–現今
- 第四選區: 1873–現今
- 第五選區: 1885–現今
- 第六選區: 1885–現今
- 第七選區: 1893–現今
- 第八選區: 1903–現今
- 第九選區: 1913–現今
- 第十選區: 1913–現今
- 第十一選區: 1913–現今
- 第十二選區: 1933–現今
- 第十三選區: 1933–現今
- 第十四選區: 1933–現今
- 第十五選區: 1933–現今
- 第十六選區: 1933–現今
- 第十七選區: 1933–現今
- 第十八選區: 1933–現今
- 第十九選區: 1933–現今
- 第二十選區: 1933–現今
- 第二十一選區: 1943–現今
- 第二十二選區: 1943–現今
- 第二十三選區: 1943–現今
- 第二十四選區: 1953–現今
- 第二十五選區: 1953–現今
- 第二十六選區: 1953–現今
- 第二十七選區: 1953–現今
- 第二十八選區: 1953–現今
- 第二十九選區: 1953–現今
- 第三十選區: 1953–現今
- 第三十一選區: 1963–現今
- 第三十二選區: 1963–現今
- 第三十三選區: 1963–現今
- 第三十四選區: 1963–現今
- 第三十五選區: 1963–現今
- 第三十六選區: 1963–現今
- 第三十七選區: 1963–現今
- 第三十八選區: 1963–現今
- 第三十九選區: 1973–現今
- 第四十選區: 1973–現今
- 第四十一選區: 1973–現今
- 第四十二選區: 1973–現今
- 第四十三選區: 1973–現今
- 第四十四選區: 1983–現今
- 第四十五選區: 1983–現今
- 第四十六選區: 1993–現今
- 第四十七選區: 1993–現今
- 第四十八選區: 1993–現今
- 第四十九選區: 1993–現今
- 第五十選區: 1993–現今
- 第五十一選區: 1993–現今
- 第五十二選區: 1993–現今
- 第五十三選區: 2003–現今
科羅拉多州 编辑

康乃狄克州 编辑

- At-large: 1789–1837, 1903–1913, 1933–1965 (obsolete)
- 1st district: 1837–present
- 2nd district: 1837–present
- 3rd district: 1837–present
- 4th district: 1837–present
- 5th district: 1837–1843, 1913–present
- 6th district: 1837–1843, 1965–2003 (obsolete since the 2000 census)
特拉華州 编辑

- At-large: 1789–present
The oldest district in the country, it has never changed its shape or size. From 1813 to 1823, Delaware had two representatives—both chosen at-large on a general ticket from the same statewide district.
哥倫比亞特區 编辑
佛羅里達 编辑

- Territory: 1822–1845 (obsolete since statehood)
- At-large: 1845–1875, 1913–1915, 1933–1937, 1943–1945 (obsolete)
- 1st district: 1875–present
- 2nd district: 1875–present
- 3rd district: 1903–present
- 4th district: 1915–present
- 5th district: 1937–present
- 6th district: 1945–present
- 7th district: 1953–present
- 8th district: 1953–present
- 9th district: 1963–present
- 10th district: 1963–present
- 11th district: 1963–present
- 12th district: 1963–present
- 13th district: 1973–present
- 14th district: 1973–present
- 15th district: 1973–present
- 16th district: 1983–present
- 17th district: 1983–present
- 18th district: 1983–present
- 19th district: 1983–present
- 20th district: 1993–present
- 21st district: 1993–present
- 22nd district: 1993–present
- 23rd district: 1993–present
- 24th district: 2003–present
- 25th district: 2003–present
- 26th district: 2013–present
- 27th district: 2013–present
佐治亞州 编辑
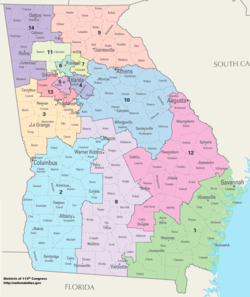
- At-large: 1793–1827, 1829–1845, 1883–1885 (obsolete)
- 1st district: 1789–1793, 1827–1829, 1845–present
- 2nd district: 1789–1793, 1827–1829, 1845–present
- 3rd district: 1789–1793, 1827–1829, 1845–present
- 4th district: 1827–1829, 1845–present
- 5th district: 1827–1829, 1845–present
- 6th district: 1827–1829, 1845–present
- 7th district: 1827–1829, 1845–present
- 8th district: 1845–1863, 1873–present
- 9th district: 1873–present
- 10th district: 1885–present
- 11th district: 1893–1933, 1993–present
- 12th district: 1913–1933, 2003–present
- 13th district: 2003–present
- 14th district: 2013–present
關島 编辑
See Non-voting delegations, below.
Hawaii 编辑

- Territory: 1900–1959 (obsolete since statehood)
- At-large: 1959–1971 (obsolete)
- 1st district: 1971–present
- 2nd district: 1971–present
Idaho 编辑
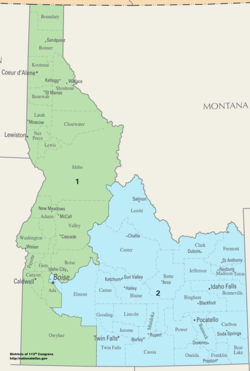
- Territory: 1864–1890 (obsolete since statehood)
- At-large: 1890–1919 (obsolete)
- 1st district: 1919–present
- 2nd district: 1919–present
Illinois 编辑

- Territory: 1812–1818 (obsolete since statehood)
- At-large: 1818–1833, 1863–1873, 1893–1895, 1913–1949 (obsolete)
- 1st district: 1833–present
- 2nd district: 1833–present
- 3rd district: 1833–present
- 4th district: 1843–present
- 5th district: 1843–present
- 6th district: 1843–present
- 7th district: 1843–present
- 8th district: 1853–present
- 9th district: 1853–present
- 10th district: 1863–present
- 11th district: 1863–present
- 12th district: 1863–present
- 13th district: 1863–present
- 14th district: 1873–present
- 15th district: 1873–present
- 16th district: 1873–present
- 17th district: 1873–present
- 18th district: 1873–present
- 19th district: 1873–2013 (obsolete since the 2010 census)
- 20th district: 1883–2003 (obsolete since the 2000 census)
- 21st district: 1895–1993 (obsolete since the 1990 census)
- 22nd district: 1895–1993 (obsolete since the 1990 census)
- 23rd district: 1903–1983 (obsolete since the 1980 census)
- 24th district: 1903–1983 (obsolete since the 1980 census)
- 25th district: 1903–1963 (obsolete since the 1960 census)
- 26th district: 1949–1953 (obsolete since the 1950 census)
Indiana 编辑

- Territory: 1805–1816 (obsolete since statehood)
- At-large: 1816–1823, 1873–1875 (obsolete)
- 1st district: 1823–present
- 2nd district: 1823–present
- 3rd district: 1823–present
- 4th district: 1833–present
- 5th district: 1833–present
- 6th district: 1833–present
- 7th district: 1833–present
- 8th district: 1843–present
- 9th district: 1843–present
- 10th district: 1843–2003 (obsolete since the 2000 census)
- 11th district: 1853–1983 (obsolete since the 1980 census)
- 12th district: 1875–1943 (obsolete since the 1940 census)
- 13th district: 1875–1933 (obsolete since the 1930 census)
Iowa 编辑

- Territory: 1838–1846 (obsolete since statehood)
- At-large: 1846–1847 (obsolete)
- 1st district: 1847–present
- 2nd district: 1847–present
- 3rd district: 1863–present
- 4th district: 1863–present
- 5th district: 1863–2013 (obsolete since the 2010 census)
- 6th district: 1863–1993 (obsolete since the 1990 census)
- 7th district: 1873–1973 (obsolete since the 1970 census)
- 8th district: 1873–1963 (obsolete since the 1960 census)
- 9th district: 1873–1943 (obsolete since the 1940 census)
- 10th district: 1883–1933 (obsolete since the 1930 census)
- 11th district: 1883–1933 (obsolete since the 1930 census)
Kansas 编辑

- Territory: 1854–1861 (obsolete since statehood)
- At-large: 1861–1875, 1883–1885, 1893–1907 (obsolete)
- 1st district: 1875–present
- 2nd district: 1875–present
- 3rd district: 1875–present
- 4th district: 1885–present
- 5th district: 1885–1993 (obsolete since the 1990 census)
- 6th district: 1885–1963 (obsolete since the 1960 census)
- 7th district: 1885–1943 (obsolete since the 1940 census)
- 8th district: 1907–1933 (obsolete since the 1930 census)
Kentucky 编辑

- At-large: 1933–1935 (obsolete)
- 1st district: 1792–1933, 1935–present
- 2nd district: 1792–1933, 1935–present
- 3rd district: 1803–1933, 1935–present
- 4th district: 1803–1933, 1935–present
- 5th district: 1803–1933, 1935–present
- 6th district: 1803–1933, 1935–present
- 7th district: 1813–1933, 1935–1993 (obsolete since the 1990 census)
- 8th district: 1813–1933, 1935–1963 (obsolete since the 1960 census)
- 9th district: 1813–1933, 1935–1953 (obsolete since the 1950 census)
- 10th district: 1813–1863, 1873–1933 (obsolete since the 1930 census)
- 11th district: 1823–1843, 1883–1933 (obsolete since the 1930 census)
- 12th district: 1823–1843 (obsolete since the 1840 census)
- 13th district: 1833–1843 (obsolete since the 1840 census)
Louisiana 编辑

- Orleans Territory: 1806–1812 (obsolete since statehood)
- At-large: 1812–1823, 1873–1875 (obsolete)
- 1st district: 1823–present
- 2nd district: 1823–present
- 3rd district: 1823–present
- 4th district: 1843–present
- 5th district: 1863–present
- 6th district: 1875–present
- 7th district: 1903–2013 (obsolete since the 2010 census)
- 8th district: 1913–1993 (obsolete since the 1990 census)
Maine 编辑
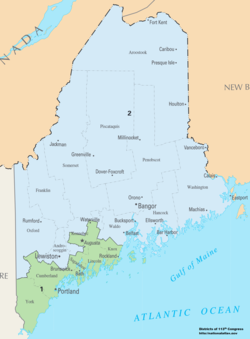
Until 1820, Maine was part of Massachusetts. After the 1810 census, Massachusetts was allocated 20 districts. Seven Massachusetts districts (then numbered 14 through 20) were credited to Maine soon after it became a state in 1820. See District of Maine.
- At-large: 1820–1821, 1883–1885 (obsolete)
- 1st district: 1821–1883, 1885–present
- 2nd district: 1821–1883, 1885–present
- 3rd district: 1821–1883, 1885–1963 (obsolete since the 1960 census)
- 4th district: 1821–1883, 1885–1933 (obsolete since the 1930 census)
- 5th district: 1821–1883 (obsolete since the 1880 census)
- 6th district: 1821–1863 (obsolete since the 1860 census)
- 7th district: 1821–1853 (obsolete since the 1850 census)
- 8th district: 1833–1843 (obsolete since the 1840 census)
Maryland 编辑
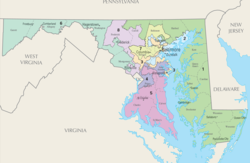
- At-large: 1963–1967 (obsolete)
- 1st district: 1789–present
- 2nd district: 1789–present
- 3rd district: 1789–present
- 4th district: 1789–present
- 5th district: 1789–present
- 6th district: 1789–1863, 1873–present
- 7th district: 1793–1843, 1953–present
- 8th district: 1793–1835, 1967–present
Massachusetts 编辑

- At-large: 1793–1795 (obsolete)
- 1st district: 1789–present
- 2nd district: 1789–present
- 3rd district: 1789–present
- 4th district: 1789–present
- 5th district: 1789–1793, 1795–present
- 6th district: 1789–1793, 1795–present
- 7th district: 1789–1793, 1795–present
- 8th district: 1789–1793, 1795–present
- 9th district: 1795–present
- 10th district: 1795–2013 (obsolete since the 2010 census)
- 11th district: 1795–1843, 1853–1863, 1873–1993 (obsolete since the 1990 census)
- 12th district: 1795–1843, 1883–1983 (obsolete since the 1980 census)
- 13th district: 1795–1833, 1893–1963 (obsolete since the 1960 census)
- 14th district: 1795–1820 (moved to Maine), 1903–1963 (obsolete since the 1960 census)
- 15th district: 1803–1820 (moved to Maine), 1913–1943 (obsolete since the 1940 census)
- 16th district: 1803–1820 (moved to Maine), 1913–1933 (obsolete since the 1930 census)
- 17th district: 1803–1820 (obsolete since 1820 move to Maine[4])
- 18th district: 1813–1820 (obsolete since 1820 move to Maine[4])
- 19th district: 1813–1820 (obsolete since 1820 move to Maine[4])
- 20th district: 1813–1820 (obsolete since 1820 move to Maine[4])
Michigan 编辑

- Territory: 1819–1837 (obsolete since statehood)
- At-large: 1835–1843, 1913–1915, 1963–1965 (obsolete)
- 1st district: 1843–present
- 2nd district: 1843–present
- 3rd district: 1843–present
- 4th district: 1853–present
- 5th district: 1863–present
- 6th district: 1863–present
- 7th district: 1873–present
- 8th district: 1873–present
- 9th district: 1873–present
- 10th district: 1883–present
- 11th district: 1883–present
- 12th district: 1893–present
- 13th district: 1915–present
- 14th district: 1933–present
- 15th district: 1933–2013 (obsolete since the 2010 census)
- 16th district: 1933–2003 (obsolete since the 2000 census)
- 17th district: 1933–1993 (obsolete since the 1990 census)
- 18th district: 1953–1993 (obsolete since the 1990 census)
- 19th district: 1965–1983 (obsolete since the 1980 census)
Minnesota 编辑

- Territory: 1849–1858 (obsolete since statehood)
- At-large: 1857–1863, 1913–1915, 1933–1935 (obsolete)
- 1st district: 1863–1933, 1935–present
- 2nd district: 1863–1933, 1935–present
- 3rd district: 1873–1933, 1935–present
- 4th district: 1883–1933, 1935–present
- 5th district: 1883–1933, 1935–present
- 6th district: 1893–1933, 1935–present
- 7th district: 1893–1933, 1935–present
- 8th district: 1903–1933, 1935–present
- 9th district: 1903–1933, 1935–1963 (obsolete since the 1960 census)
- 10th district: 1915–1933 (obsolete since the 1930 census)
Mississippi 编辑

- Territory: 1801–1817 (obsolete since statehood)
- At-large: 1817–1847, 1853–1855 (obsolete)
- 1st district: 1847–present
- 2nd district: 1847–present
- 3rd district: 1847–present
- 4th district: 1847–present
- 5th district: 1855–2003 (obsolete since the 2000 census)
- 6th district: 1873–1963 (obsolete since the 1960 census)
- 7th district: 1883–1953 (obsolete since the 1950 census)
- 8th district: 1903–1933 (obsolete since the 1930 census)
Missouri 编辑
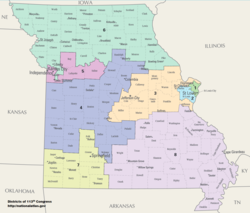
- Territory: 1812–1821 (obsolete since statehood)
- At-large: 1821–1847, 1933–1935 (obsolete)
- 1st district: 1847–1933, 1935–present
- 2nd district: 1847–1933, 1935–present
- 3rd district: 1847–1933, 1935–present
- 4th district: 1847–1933, 1935–present
- 5th district: 1847–1933, 1935–present
- 6th district: 1853–1933, 1935–present
- 7th district: 1853–1933, 1935–present
- 8th district: 1863–1933, 1935–present
- 9th district: 1863–1933, 1935–2013 (obsolete since the 2010 census)
- 10th district: 1873–1933, 1935–1983 (obsolete since the 1980 census)
- 11th district: 1873–1933, 1935–1963 (obsolete since the 1960 census)
- 12th district: 1873–1933, 1935–1953 (obsolete since the 1950 census)
- 13th district: 1873–1933, 1935–1953 (obsolete since the 1950 census)
- 14th district: 1883–1933 (obsolete since the 1930 census)
- 15th district: 1893–1933 (obsolete since the 1930 census)
- 16th district: 1903–1933 (obsolete since the 1930 census)
Montana 编辑

- Territory: 1865–1889 (obsolete since statehood)
- At-large: 1889–1919, 1993–present
- 1st district: 1919–1993 (obsolete since the 1990 census)
- 2nd district: 1919–1993 (obsolete since the 1990 census)
Nebraska 编辑

- Territory: 1855–1867 (obsolete since statehood)
- At-large: 1867–1883 (obsolete)
- 1st district: 1883–present
- 2nd district: 1883–present
- 3rd district: 1883–present
- 4th district: 1893–1963 (obsolete since the 1960 census)
- 5th district: 1893–1943 (obsolete since the 1940 census)
- 6th district: 1893–1933 (obsolete since the 1930 census)
Nevada 编辑

- Territory: 1861–1864 (obsolete since statehood)
- At-large: 1864–1983 (obsolete)
- 1st district: 1983–present
- 2nd district: 1983–present
- 3rd district: 2003–present
- 4th district: 2013–present
New Hampshire 编辑

- At-large: 1789–1847 (obsolete)
- 1st district: 1847–present
- 2nd district: 1847–present
- 3rd district: 1847–1883 (obsolete since the 1880 census)
- 4th district: 1847–1853 (obsolete since the 1850 census)
New Jersey 编辑

- At-large: 1789–1799, 1801–1813, 1815–1843 (obsolete)
- 1st district: 1799–1801, 1813–1815, 1843–present
- 2nd district: 1799–1801, 1813–1815, 1843–present
- 3rd district: 1799–1801, 1813–1815, 1843–present
- 4th district: 1799–1801, 1843–present
- 5th district: 1799–1801, 1843–present
- 6th district: 1873–present
- 7th district: 1873–present
- 8th district: 1893–present
- 9th district: 1903–present
- 10th district: 1903–present
- 11th district: 1913–present
- 12th district: 1913–present
- 13th district: 1933–2013 (obsolete since the 2010 census)
- 14th district: 1933–1993 (obsolete since the 1990 census)
- 15th district: 1963–1983 (obsolete since the 1980 census)
New Mexico 编辑

- Territory: 1851–1912 (obsolete since statehood)
- At-large: 1912–1969 (obsolete)
- 1st district: 1969–present
- 2nd district: 1969–present
- 3rd district: 1983–present
New York 编辑

- At-large: 1873–1875, 1883–1885, 1933–1945 (obsolete)
- 1st district: 1789–present
- 2nd district: 1789–present
- 3rd district: 1789–present
- 4th district: 1789–present
- 5th district: 1789–present
- 6th district: 1789–present
- 7th district: 1793–present
- 8th district: 1793–present
- 9th district: 1793–present
- 10th district: 1793–present
- 11th district: 1803–present
- 12th district: 1803–present
- 13th district: 1803–present
- 14th district: 1803–present
- 15th district: 1803–present
- 16th district: 1803–1809, 1813–present
- 17th district: 1803–1809, 1813–present
- 18th district: 1813–present
- 19th district: 1813–present
- 20th district: 1813–present
- 21st district: 1813–present
- 22nd district: 1821–present
- 23rd district: 1823–present
- 24th district: 1823–present
- 25th district: 1823–present
- 26th district: 1823–present
- 27th district: 1823–present
- 28th district: 1823–2013 (obsolete since the 2010 census)
- 29th district: 1823–2013 (obsolete since the 2010 census)
- 30th district: 1823–2003 (obsolete since the 2000 census)
- 31st district: 1833–2003 (obsolete since the 2000 census)
- 32nd district: 1833–1863, 1873–1993 (obsolete since the 1990 census)
- 33rd district: 1833–1863, 1875–1993 (obsolete since the 1990 census)
- 34th district: 1843–1853, 1885–1993 (obsolete since the 1990 census)
- 35th district: 1903–1983 (obsolete since the 1980 census)
- 36th district: 1903–1983 (obsolete since the 1980 census)
- 37th district: 1903–1983 (obsolete since the 1980 census)
- 38th district: 1913–1983 (obsolete since the 1980 census)
- 39th district: 1913–1983 (obsolete since the 1980 census)
- 40th district: 1913–1973 (obsolete since the 1970 census)
- 41st district: 1913–1973 (obsolete since the 1970 census)
- 42nd district: 1913–1963 (obsolete since the 1960 census)
- 43rd district: 1913–1963 (obsolete since the 1960 census)
- 44th district: 1945–1953 (obsolete since the 1950 census)
- 45th district: 1945–1953 (obsolete since the 1950 census)
North Carolina 编辑

- At-large: 1883–1885 (obsolete)
- 1st district: 1789–present
- 2nd district: 1789–present
- 3rd district: 1789–present
- 4th district: 1789–present
- 5th district: 1789–present
- 6th district: 1793–present
- 7th district: 1793–present
- 8th district: 1793–1863, 1873–present
- 9th district: 1793–1853, 1885–present
- 10th district: 1793–1843, 1903–present
- 11th district: 1803–1843, 1933–present
- 12th district: 1803–1843, 1943–1963, 1993–present
- 13th district: 1813–1843, 2003–present
North Dakota 编辑

- Dakota Territory: 1861–1889 (obsolete since statehood)
- At-large: 1889–1913, 1933–1963, 1973–present
- 1st district: 1913–1933, 1963–1973 (obsolete since the 1970 census)
- 2nd district: 1913–1933, 1963–1973 (obsolete since the 1970 census)
- 3rd district: 1913–1933 (obsolete since the 1930 census)
Northern Mariana Islands 编辑
- See Non-voting delegations, below.
Ohio 编辑

- Northwest Territory: 1799–1803 (obsolete since statehood)
- At-large: 1803–1813, 1913–1915, 1933–1953, 1963–1967 (obsolete)
- 1st district: 1813–present
- 2nd district: 1813–present
- 3rd district: 1813–present
- 4th district: 1813–present
- 5th district: 1813–present
- 6th district: 1813–present
- 7th district: 1823–present
- 8th district: 1823–present
- 9th district: 1823–present
- 10th district: 1823–present
- 11th district: 1823–present
- 12th district: 1823–present
- 13th district: 1823–present
- 14th district: 1823–present
- 15th district: 1833–present
- 16th district: 1833–present
- 17th district: 1833–2013 (obsolete since the 2010 census)
- 18th district: 1833–2013 (obsolete since the 2010 census)
- 19th district: 1833–2003 (obsolete since the 2000 census)
- 20th district: 1843–1863, 1873–1993 (obsolete since the 1990 census)
- 21st district: 1843–1863, 1883–1993 (obsolete since the 1990 census)
- 22nd district: 1915–1983 (obsolete since the 1980 census)
- 23rd district: 1953–1983 (obsolete since the 1980 census)
- 24th district: 1967–1973 (obsolete since the 1970 census)
Oklahoma 编辑

- Territory: 1890–1907 (obsolete since statehood)
- At-large: 1913–1915, 1933–1943 (obsolete)
- 1st district: 1907–present
- 2nd district: 1907–present
- 3rd district: 1907–present
- 4th district: 1907–present
- 5th district: 1907–present
- 6th district: 1915–2003 (obsolete since the 2000 census)
- 7th district: 1915–1953 (obsolete since the 1950 census)
- 8th district: 1915–1953 (obsolete since the 1950 census)
Oregon 编辑

- Territory: 1849–1859 (obsolete since statehood)
- At-large: 1859–1893 (obsolete)
- 1st district: 1893–present
- 2nd district: 1893–present
- 3rd district: 1913–present
- 4th district: 1943–present
- 5th district: 1983–present
Pennsylvania 编辑
- At-large: 1789–1791, 1793–1795, 1873–1875, 1883–1889, 1893–1903, 1913–1923, 1943–1945 (obsolete)
- 1st district: 1791–1793, 1795–present
- 2nd district: 1791–1793, 1795–present
- 3rd district: 1791–1793, 1795–present
- 4th district: 1791–1793, 1795–present
- 5th district: 1791–1793, 1795–present
- 6th district: 1791–1793, 1795–present
- 7th district: 1791–1793, 1795–present
- 8th district: 1791–1793, 1795–present
- 9th district: 1795–present
- 10th district: 1795–present
- 11th district: 1795–present
- 12th district: 1795–1803, 1813–present
- 13th district: 1813–present
- 14th district: 1813–present
- 15th district: 1813–present
- 16th district: 1823–present
- 17th district: 1823–present
- 18th district: 1823–present
- 19th district: 1833–2013 (obsolete since the 2010 census)
- 20th district: 1833–2003 (obsolete since the 2000 census)
- 21st district: 1833–2003 (obsolete since the 2000 census)
- 22nd district: 1833–1993 (obsolete since the 1990 census)
- 23rd district: 1833–1993 (obsolete since the 1990 census)
- 24th district: 1833–1983 (obsolete since the 1980 census)
- 25th district: 1833–1843, 1853–1863, 1875–1983 (obsolete since the 1980 census)
- 26th district: 1875–1973 (obsolete since the 1970 census)
- 27th district: 1875–1973 (obsolete since the 1970 census)
- 28th district: 1889–1963 (obsolete since the 1960 census)
- 29th district: 1903–1963 (obsolete since the 1960 census)
- 30th district: 1903–1963 (obsolete since the 1960 census)
- 31st district: 1903–1953 (obsolete since the 1950 census)
- 32nd district: 1903–1953 (obsolete since the 1950 census)
- 33rd district: 1923–1953 (obsolete since the 1950 census)
- 34th district: 1923–1943 (obsolete since the 1940 census)
- 35th district: 1923–1933 (obsolete since the 1930 census)
- 36th district: 1923–1933 (obsolete since the 1930 census)
Philippines 编辑
- See Non-voting delegations, below.
Puerto Rico 编辑
- See Non-voting delegations, below.
Rhode Island 编辑

- At-large: 1790–1843 (obsolete)
- 1st district: 1843–present
- 2nd district: 1843–present
- 3rd district: 1913–1933 (obsolete since the 1930 census)
South Carolina 编辑

- At-large: 1873–1875 (obsolete)
- 1st district: 1789–present
- 2nd district: 1789–present
- 3rd district: 1789–present
- 4th district: 1789–present
- 5th district: 1789–1863, 1875–present
- 6th district: 1793–1863, 1883–present
- 7th district: 1803–1853, 1883–1933, 2013–present
- 8th district: 1803–1843 (obsolete since the 1840 census)
- 9th district: 1813–1843 (obsolete since the 1840 census)
South Dakota 编辑

- Dakota Territory 1861–1889 (obsolete since statehood)
- At-large: 1889–1913, 1983–present
- 1st district: 1913–1983 (obsolete since the 1980 census)
- 2nd district: 1913–1983 (obsolete since the 1980 census)
- 3rd district: 1913–1933 (obsolete since the 1930 census)
Tennessee 编辑

- Southwest Territory: 1794–1796 (obsolete since statehood)
- At-large: 1796–1805, 1873–1875 (obsolete)
- 1st district: 1805–present
- 2nd district: 1805–present
- 3rd district: 1805–present
- 4th district: 1813–present
- 5th district: 1813–present
- 6th district: 1813–present
- 7th district: 1823–present
- 8th district: 1823–present
- 9th district: 1823–1863, 1873–1973, 1983–present
- 10th district: 1833–1863, 1875–1933, 1943–1953 (obsolete since the 1950 census)
- 11th district: 1833–1853 (obsolete since the 1850 census)
- 12th district: 1833–1843 (obsolete since the 1840 census)
- 13th district: 1833–1843 (obsolete since the 1840 census)
Texas 编辑

- At-large: 1873–1875, 1913–1919, 1933–1935, 1953–1959, 1963–1967 (obsolete)
- 1st district: 1845–present
- 2nd district: 1845–present
- 3rd district: 1863–present
- 4th district: 1863–present
- 5th district: 1875–present
- 6th district: 1875–present
- 7th district: 1883–present
- 8th district: 1883–present
- 9th district: 1883–present
- 10th district: 1883–present
- 11th district: 1883–present
- 12th district: 1893–present
- 13th district: 1893–present
- 14th district: 1903–present
- 15th district: 1903–present
- 16th district: 1903–present
- 17th district: 1919–present
- 18th district: 1919–present
- 19th district: 1935–present
- 20th district: 1935–present
- 21st district: 1935–present
- 22nd district: 1959–present
- 23rd district: 1967–present
- 24th district: 1973–present
- 25th district: 1983–present
- 26th district: 1983–present
- 27th district: 1983–present
- 28th district: 1993–present
- 29th district: 1993–present
- 30th district: 1993–present
- 31st district: 2003–present
- 32nd district: 2003–present
- 33rd district: 2013–present
- 34th district: 2013–present
- 35th district: 2013–present
- 36th district: 2013–present
U.S. Virgin Islands 编辑
- See Non-voting delegations, below.
Utah 编辑

- Territory (obsolete since statehood)
- At-large: 1896–1913 (obsolete)
- 1st district: 1913–present
- 2nd district: 1913–present
- 3rd district: 1983–present
- 4th district: 2013–present
Vermont 编辑

- At-large: 1813–1821, 1823–1825, 1933–present
- 1st district: 1791–1813, 1821–1823, 1825–1933 (obsolete since the 1930 census)
- 2nd district: 1791–1813, 1821–1823, 1825–1933 (obsolete since the 1930 census)
- 3rd district: 1803–1813, 1821–1823, 1825–1883 (obsolete since the 1880 census)
- 4th district: 1803–1813, 1821–1823, 1825–1853 (obsolete since the 1850 census)
- 5th district: 1821–1823, 1825–1843 (obsolete since the 1840 census)
- 6th district: 1821–1823 (obsolete since the 1820 census)
Virginia 编辑

- At-large: 1883–1885, 1933–1935 (obsolete)
- 1st district: 1789–1933, 1935–present
- 2nd district: 1789–1933, 1935–present
- 3rd district: 1789–1933, 1935–present
- 4th district: 1789–1933, 1935–present
- 5th district: 1789–1933, 1935–present
- 6th district: 1789–1933, 1935–present
- 7th district: 1789–1933, 1935–present
- 8th district: 1789–1933, 1935–present
- 9th district: 1789–1863, 1873–1933, 1935–present
- 10th district: 1789–1863, 1885–1933, 1953–present
- 11th district: 1793–1863, 1993–present
- 12th district: 1793–1863 (obsolete since the 1863 move to West Virginia)
- 13th district: 1793–1863 (obsolete since the 1863 move to West Virginia)
- 14th district: 1793–1853 (obsolete since the 1850 census)
- 15th district: 1793–1853 (obsolete since the 1850 census)
- 16th district: 1793–1843 (obsolete since the 1840 census)
- 17th district: 1793–1843 (obsolete since the 1840 census)
- 18th district: 1793–1843 (obsolete since the 1840 census)
- 19th district: 1793–1843 (obsolete since the 1840 census)
- 20th district: 1803–1843 (obsolete since the 1840 census)
- 21st district: 1803–1843 (obsolete since the 1840 census)
- 22nd district: 1803–1833 (obsolete since the 1830 census)
- 23rd district: 1813–1823 (obsolete since the 1820 census)
Washington 编辑

- Territory: 1854–1889 (obsolete since statehood)
- At-large: 1889–1909, 1913–1915, 1953–1959 (obsolete)
- 1st district: 1909–present
- 2nd district: 1909–present
- 3rd district: 1909–present
- 4th district: 1915–present
- 5th district: 1915–present
- 6th district: 1933–present
- 7th district: 1959–present
- 8th district: 1983–present
- 9th district: 1993–present
- 10th district: 2013–present
West Virginia 编辑

- At-large: 1913–1917 (obsolete)
- 1st district: 1863–present
- 2nd district: 1863–present
- 3rd district: 1863–present
- 4th district: 1883–1993 (obsolete since the 1990 census)
- 5th district: 1903–1973 (obsolete since the 1970 census)
- 6th district: 1917–1963 (obsolete since the 1960 census)
Wisconsin 编辑

- Territory: 1836–1848 (obsolete since statehood)
- 1st district: 1848–present
- 2nd district: 1848–present
- 3rd district: 1849–present
- 4th district: 1863–present
- 5th district: 1863–present
- 6th district: 1863–present
- 7th district: 1873–present
- 8th district: 1873–present
- 9th district: 1883–2003 (obsolete since the 2000 census)
- 10th district: 1893–1973 (obsolete since the 1970 census)
- 11th district: 1903–1933 (obsolete since the 1930 census)
Wyoming 编辑

Non-voting delegations 编辑
- American Samoa, 1978–present
- District of Columbia, 1871–1875 & 1971–present
- Guam, 1970–present
- Northern Mariana Islands, 2009–present
- Philippines, 1907–1946 (obsolete since independence)
- Puerto Rico, 1901–present
- United States Virgin Islands, 1970–present
現今國會選區列表(依面積大小排列) 编辑
這個列表裡包括現今尚存的435個國會選區合6個無國會表決權的選區。[6] These geographic values reflect the changes to the Pennsylvania Congressional Districts in 2018.[7]
| Rank large |
District | Land area (mi²) |
Land area (km²) |
|---|---|---|---|
| 1 | Alaska at-large | 571,951.26 | 1,481,353.76 |
| 2 | Montana at-large | 145,552.44 | 376,980.82 |
| 3 | Wyoming at-large | 97,100.40 | 251,490.04 |
| 4 | South Dakota at-large | 75,884.64 | 196,541.22 |
| 5 | New Mexico 2nd | 71,739.49 | 185,805.46 |
| 6 | Oregon 2nd | 69,442.78 | 179,856.98 |
| 7 | North Dakota at-large | 68,975.93 | 178,647.66 |
| 8 | Nebraska 3rd | 67,435.41 | 174,657.89 |
| 9 | Texas 23rd | 58,059.18 | 150,373.43 |
| 10 | Nevada 2nd | 55,829.71 | 144,599.09 |
| 11 | Arizona 1st | 55,039.61 | 142,552.73 |
| 12 | Kansas 1st | 52,542.5 | 136,085.21 |
| 13 | Nevada 4th | 50,997.97 | 132,084.87 |
| 14 | Colorado 3rd | 49,731.77 | 128,805.41 |
| 15 | New Mexico 3rd | 44,958.52 | 116,442.68 |
| 16 | Idaho 2nd | 43,225.09 | 111,953.1 |
| 17 | Utah 2nd | 39,987.95 | 103,568.89 |
| 18 | Idaho 1st | 39,418.02 | 102,092.77 |
| 19 | Texas 13th | 38,349.24 | 99,324.63 |
| 20 | Colorado 4th | 38,102.67 | 98,686.01 |
| 21 | Oklahoma 3rd | 34,116.73 | 88,362.42 |
| 22 | Minnesota 7th | 33,429.31 | 86,582 |
| 23 | Arizona 4th | 33,199.45 | 85,986.66 |
| 24 | California 8th | 32,867.21 | 85,126.16 |
| 25 | California 1st | 28,089.47 | 72,751.8 |
| 26 | Minnesota 8th | 27,908.13 | 72,282.13 |
| 27 | Texas 11th | 27,832.17 | 72,085.39 |
| 28 | Maine 2nd | 27,557.4 | 71,373.74 |
| 29 | Texas 19th | 25,835.59 | 66,914.25 |
| 30 | Michigan 1st | 25,027.75 | 64,821.94 |
| 31 | Wisconsin 7th | 23,037.26 | 59,666.56 |
| 32 | Iowa 4th | 22,756.75 | 58,940.04 |
| 33 | Arkansas 4th | 22,338.08 | 57,855.69 |
| 34 | Oklahoma 2nd | 20,995.35 | 54,378.01 |
| 35 | Utah 3rd | 20,070.54 | 51,982.75 |
| 36 | Missouri 8th | 19,901.17 | 51,544.08 |
| 37 | Utah 1st | 19,560.79 | 50,662.5 |
| 38 | Arkansas 1st | 19,318.29 | 50,034.42 |
| 39 | Washington 4th | 19,250.22 | 49,858.12 |
| 40 | Missouri 6th | 18,198.62 | 47,134.47 |
| 41 | Oregon 4th | 17,274.04 | 44739.81 |
| 42 | Arizona 3rd | 15,688.79 | 40,634.01 |
| 43 | Mississippi 2nd | 15,551.51 | 40,278.45 |
| 44 | Washington 5th | 15,473.13 | 40,075.45 |
| 45 | New York 21st | 15,114.76 | 39,147.27 |
| 46 | Illinois 15th | 14,695.67 | 38,061.82 |
| 47 | Louisiana 5th | 14,452.88 | 37,433 |
| 48 | Missouri 4th | 14,401.38 | 37,299.61 |
| 49 | Kansas 4th | 14,315.68 | 37,077.65 |
| 50 | Kansas 2nd | 14,143.34 | 36,631.29 |
| 51 | California 2nd | 12,952.23 | 33,546.31 |
| 52 | California 4th | 12,836.2 | 33,245.79 |
| 53 | Mississippi 3rd | 12,754.48 | 33,034.14 |
| 54 | Louisiana 4th | 12,435.1 | 32,206.94 |
| 55 | Iowa 2nd | 12,261.92 | 31,758.40 |
| 56 | Kentucky 1st | 12,079.5 | 31,285.94 |
| 57 | Iowa 1st | 12,048.84 | 31,206.53 |
| 58 | Minnesota 1st | 11,973.99 | 31,012.67 |
| 59 | Kentucky 5th | 11,235.15 | 29,099.07 |
| 60 | Wisconsin 3rd | 11,111.79 | 28,779.56 |
| 61 | Mississippi 1st | 10,572.8 | 27,383.58 |
| 62 | Illinois 18th | 10,515.95 | 27,236.34 |
| 63 | Alabama 7th | 10,156.13 | 26,304.40 |
| 64 | Alabama 2nd | 10,141.63 | 26,266.85 |
| 65 | Texas 4th | 10,122.99 | 26,218.57 |
| 66 | Virginia 5th | 10,029.79 | 25,977.18 |
| 67 | California 23rd | 9,898 | 25,635.85 |
| 68 | Pennsylvania 12th | 9,893.40 | 25,623.80 |
| 69 | Oklahoma 4th | 9,777.28 | 25,323.18 |
| 70 | West Virginia 3rd | 9,745.33 | 25,240.43 |
| 71 | Pennsylvania 15th | 9,729.03 | 25,198.09 |
| 72 | Georgia 2nd | 9,626.23 | 24,931.96 |
| 73 | Texas 28th | 9,378.53 | 24,290.42 |
| 74 | Vermont at-large | 9,249.56 | 23,956.36 |
| 75 | Tennessee 7th | 9,160.44 | 23,725.56 |
| 76 | Texas 27th | 9,128.25 | 23,642.19 |
| 77 | Washington 3rd | 9,114.01 | 23,605.31 |
| 78 | Virginia 9th | 9,113.87 | 23,604.95 |
| 79 | Alabama 4th | 8,888.77 | 23,021.94 |
| 80 | Nebraska 1st | 8,879.02 | 22,996.68 |
| 81 | Iowa 3rd | 8,789.62 | 22,765.14 |
| 82 | Georgia 8th | 8,711.64 | 22,563.17 |
| 83 | Florida 2nd | 8,613.58 | 22,309.19 |
| 84 | Michigan 4th | 8,457.8 | 21,905.72 |
| 85 | Texas 34th | 8,190.32 | 21,212.95 |
| 86 | Georgia 12th | 8,185.27 | 21,199.87 |
| 87 | South Carolina 6th | 8,062.93 | 20,883.01 |
| 88 | Mississippi 4th | 8,044.48 | 20,835.22 |
| 89 | West Virginia 2nd | 8,017.31 | 20,764.85 |
| 90 | Georgia 1st | 7,982.81 | 20,675.5 |
| 91 | New York 19th | 7,937.02 | 20,556.90 |
| 92 | Illinois 16th | 7,917.49 | 20,506.32 |
| 93 | Texas 1st | 7,858.86 | 20,354.47 |
| 94 | Arizona 2nd | 7,838.12 | 20,300.75 |
| 95 | North Carolina 3rd | 7,810.08 | 20,228.13 |
| 96 | Texas 15th | 7,804.07 | 20,212.56 |
| 97 | Texas 17th | 7,651.16 | 19,816.52 |
| 98 | Texas 25th | 7,620.7 | 19,737.63 |
| 99 | Alabama 3rd | 7,543.86 | 19,538.62 |
| 100 | Colorado 2nd | 7,535.34 | 19,516.55 |
| 101 | New York 23rd | 7,371.65 | 19,092.59 |
| 102 | Washington 8th | 7,359.7 | 19,061.64 |
| 103 | Florida 3rd | 7,306.05 | 18,922.69 |
| 104 | Colorado 5th | 7,265.72 | 18,818.23 |
| 105 | Indiana 8th | 7,255.39 | 18,791.48 |
| 106 | Ohio 6th | 7,215.03 | 18,686.95 |
| 107 | Kentucky 2nd | 7,177.44 | 18,589.59 |
| 108 | Texas 36th | 7,125.83 | 18,455.92 |
| 109 | Georgia 10th | 7,096.22 | 18,379.23 |
| 110 | Louisiana 3rd | 6,983.32 | 18,086.82 |
| 111 | Illinois 17th | 6,933.08 | 17,956.7 |
| 112 | Washington 6th | 6,902.73 | 17,878.09 |
| 113 | California 24th | 6,883.35 | 17,827.89 |
| 114 | Missouri 3rd | 6,851.54 | 17,745.51 |
| 115 | Tennessee 8th | 6,850.53 | 17,742.89 |
| 116 | North Carolina 11th | 6,838.24 | 17,711.06 |
| 117 | Wisconsin 8th | 6,806.67 | 17,629.29 |
| 118 | California 21st | 6,729.94 | 17,430.56 |
| 119 | New Hampshire 2nd | 6,489 | 16,806.53 |
| 120 | Tennessee 6th | 6,474.21 | 16,768.22 |
| 121 | Florida 17th | 6,369.97 | 16,498.24 |
| 122 | Indiana 4th | 6,352.55 | 16,453.12 |
| 123 | West Virginia 1st | 6,275.56 | 16,253.72 |
| 124 | Missouri 7th | 6,272.84 | 16,246.67 |
| 125 | Hawaii 2nd | 6,213.4 | 16,092.72 |
| 126 | Indiana 6th | 6,206.83 | 16,075.71 |
| 127 | Washington 1st | 6,186.47 | 16,022.97 |
| 128 | California 3rd | 6,183.59 | 16,015.51 |
| 129 | North Carolina 7th | 6,161.77 | 15,959 |
| 130 | Alabama 1st | 6,066.83 | 15,713.11 |
| 131 | Texas 8th | 6,053.76 | 15,679.25 |
| 133 | Tennessee 4th | 5,984.84 | 15,500.75 |
| 132 | Pennsylvania 13th | 6,017.99 | 15,586.54 |
| 134 | Virginia 6th | 5,930.02 | 15,358.77 |
| 135 | Texas 21st | 5,920.89 | 15,335.12 |
| 136 | California 36th | 5,912.64 | 15,313.75 |
| 137 | Illinois 13th | 5,793.65 | 15,005.57 |
| 138 | Ohio 5th | 5,626.47 | 14,572.57 |
| 139 | South Carolina 5th | 5,505.54 | 14,259.36 |
| 140 | North Carolina 1st | 5,494.28 | 14,230.2 |
| 141 | Arkansas 3rd | 5,400.99 | 13,988.58 |
| 142 | South Carolina 7th | 5,354.62 | 13,868.48 |
| 143 | South Carolina 3rd | 5,268.28 | 13,644.86 |
| 144 | Georgia 9th | 5,210.81 | 13,496.01 |
| 145 | Oregon 5th | 5,189.73 | 13,441.41 |
| 146 | New York 22nd | 5,077.45 | 13,150.61 |
| 147 | Texas 10th | 5,070.95 | 13,133.77 |
| 148 | Texas 5th | 5,043.85 | 13,063.58 |
| 149 | Illinois 12th | 5,008.21 | 12,971.28 |
| 150 | Arkansas 2nd | 4,978.12 | 12,893.34 |
| 151 | Wisconsin 6th | 4,918.39 | 12,738.64 |
| 152 | California 20th | 4,874.22 | 12,624.24 |
| 153 | California 51st | 4,791.61 | 12,410.28 |
| 154 | Ohio 15th | 4,738.93 | 12,273.84 |
| 155 | Ohio 4th | 4,664.87 | 12,082.03 |
| 156 | New Mexico 1st | 4,600.14 | 11,914.37 |
| 157 | Tennessee 3rd | 4,570.32 | 11,837.14 |
| 158 | Wisconsin 2nd | 4,536.69 | 11,750.04 |
| 159 | North Carolina 8th | 4,512.78 | 11,688.11 |
| 160 | Indiana 9th | 4,486.77 | 11,620.75 |
| 161 | Kentucky 4th | 4,382.19 | 11,349.88 |
| 162 | Virginia 4th | 4,310.34 | 11,163.79 |
| 163 | Kentucky 6th | 4,292.72 | 11,118.16 |
| 164 | Michigan 7th | 4,227.73 | 10,949.83 |
| 165 | Indiana 3rd | 4,180.37 | 10,827.17 |
| 166 | Alabama 6th | 4,170.78 | 10,802.331 |
| 167 | Tennessee 1st | 4,141.92 | 10,727.58 |
| 168 | Michigan 10th | 4,140.44 | 10,723.75 |
| 169 | Louisiana 6th | 4,033.89 | 10,447.79 |
| 170 | Louisiana 1st | 4,030.23 | 10,438.31 |
| 171 | Florida 1st | 4,016.3 | 10,402.23 |
| 172 | Maryland 1st | 3,977.06 | 10,300.6 |
| 173 | New York 27th | 3,973.13 | 10,290.42 |
| 174 | Indiana 2nd | 3,958.58 | 10,252.73 |
| 175 | Ohio 7th | 3,864.76 | 10,009.74 |
| 176 | Georgia 3rd | 3,838.27 | 9,941.13 |
| 177 | Virginia 1st | 3,684.32 | 9,542.4 |
| 178 | Alabama 5th | 3,677.31 | 9,524.24 |
| 179 | North Carolina 6th | 3,674.55 | 9517.09 |
| 180 | Georgia 14th | 3,623.16 | 9,383.99 |
| 181 | North Carolina 5th | 3,571.86 | 9,251.13 |
| 182 | Michigan 6th | 3,546.74 | 9,186.07 |
| — | Puerto Rico at-large | 3515 | 9100 |
| 183 | Pennsylvania 16th | 3,311.66 | 8,577.18 |
| 184 | Pennsylvania 9th | 3,295.29 | 8,534.78 |
| 185 | Maine 1st | 3,285.52 | 8,509.51 |
| 186 | Michigan 2nd | 3,281.19 | 8,498.29 |
| 187 | North Carolina 2nd | 3,246.68 | 8,408.91 |
| 188 | Florida 25th | 3,232.71 | 8,372.73 |
| 189 | Ohio 2nd | 3,221.62 | 8,344 |
| 190 | South Carolina 2nd | 3,022.17 | 7,827.43 |
| 191 | Oregon 1st | 3,007 | 7,788.14 |
| 192 | Minnesota 6th | 2,882.22 | 7,464.96 |
| 193 | Nevada 3rd | 2,848.99 | 7,378.89 |
| 194 | Pennsylvania 14th | 2,847.65 | 7,375.38 |
| 195 | California 16th | 2,839.51 | 7,354.34 |
| 196 | California 50th | 2,787.35 | 7,219.24 |
| 197 | Virginia 7th | 2,776.39 | 7,190.86 |
| 198 | Pennsylvania 8th | 2,667.87 | 6,909.77 |
| 199 | Michigan 3rd | 2,628.74 | 6,808.44 |
| 200 | North Carolina 10th | 2,575.16 | 6,669.67 |
| 201 | Utah 4th | 2,550.35 | 6,605.41 |
| 202 | Florida 11th | 2,509.88 | 6,500.6 |
| 203 | Florida 6th | 2,506.92 | 6,492.93 |
| 204 | New Hampshire 1st | 2,463.65 | 6,380.86 |
| 205 | Ohio 8th | 2,450.49 | 6,346.78 |
| 206 | Texas 14th | 2,441.39 | 6,323.21 |
| 207 | Minnesota 2nd | 2,437.91 | 6,314.19 |
| 208 | Florida 20th | 2,427.42 | 6,287.02 |
| 209 | Missouri 5th | 2,424.85 | 6,280.37 |
| 210 | New York 24th | 2,388.56 | 6,186.38 |
| 211 | Massachusetts 1st | 2,350.29 | 6,087.26 |
| 212 | Michigan 5th | 2,348.70 | 6,083.14 |
| 213 | Tennessee 2nd | 2,320.68 | 6,010.57 |
| 214 | North Carolina 13th | 2,280.59 | 5,906.73 |
| 215 | Ohio 12th | 2,271.91 | 5,884.25 |
| 216 | Texas 31st | 2,154.49 | 5,580.13 |
| 217 | Texas 6th | 2,148.41 | 5,564.39 |
| 218 | Florida 26th | 2,098.66 | 5,435.53 |
| 219 | New Jersey 2nd | 2,092.43 | 5,419.40 |
| 220 | Oklahoma 5th | 2,073.90 | 5,371.41 |
| 221 | Connecticut 2nd | 1,987.68 | 5,148.10 |
| 222 | Ohio 14th | 1,953.14 | 5,058.64 |
| 223 | Maryland 6th | 1,950.26 | 5,051.18 |
| 224 | Delaware at-large | 1,949.00 | 5,047.00 |
| 225 | Indiana 5th | 1,924.76 | 4,985.13 |
| 226 | Wisconsin 5th | 1,890.75 | 4,897.05 |
| 227 | Florida 4th | 1,875.97 | 4,858.77 |
| 228 | California 10th | 1,818.79 | 4,710.67 |
| 229 | Florida 8th | 1,752.06 | 4,537.84 |
| 230 | California 5th | 1,730.82 | 4,482.83 |
| 231 | Wisconsin 1st | 1,727.92 | 4,475.32 |
| 232 | Florida 9th | 1,707.49 | 4,422.40 |
| 233 | California 25th | 1,690.50 | 4,378.40 |
| 234 | Oklahoma 1st | 1,631.67 | 4,226.03 |
| 235 | Massachusetts 2nd | 1,628.00 | 4,216.52 |
| 236 | Illinois 14th | 1,597.60 | 4,137.79 |
| 237 | South Carolina 1st | 1,547.86 | 4,008.96 |
| 238 | Florida 18th | 1,512.55 | 3,917.51 |
| 239 | Michigan 8th | 1,503.18 | 3,893.24 |
| 240 | Pennsylvania 11th | 1,502.96 | 3,892.66 |
| 241 | Maryland 5th | 1,481.24 | 3,836.42 |
| 242 | Texas 12th | 1,441.16 | 3,732.61 |
| 243 | Virginia 10th | 1,372.24 | 3,554.11 |
| 244 | Florida 5th | 1,355.03 | 3,509.53 |
| 245 | New York 18th | 1,353.42 | 3,505.36 |
| 246 | South Carolina 4th | 1,299.30 | 3,365.19 |
| 247 | Louisiana 2nd | 1,268.48 | 3,285.37 |
| 248 | Tennessee 5th | 1,248.57 | 3,233.80 |
| 249 | Connecticut 5th | 1,248.16 | 3,232.74 |
| 250 | California 9th | 1,245.28 | 3,225.28 |
| 251 | New York 20th | 1,231.28 | 3,189.02 |
| 252 | Massachusetts 9th | 1,214.74 | 3,146.18 |
| 253 | Ohio 16th | 1,205.34 | 3,121.83 |
| 254 | California 22nd | 1,165.12 | 3,017.66 |
| 255 | Indiana 1st | 1,157.02 | 2,996.68 |
| 256 | Ohio 10th | 1,129.76 | 2,926.08 |
| 257 | Florida 10th | 1,129.32 | 2,924.94 |
| 258 | Illinois 2nd | 1,080.67 | 2,798.94 |
| 259 | Pennsylvania 10th | 1,080.26 | 2,797.86 |
| 260 | Oregon 3rd | 1,074.46 | 2,782.85 |
| 261 | Georgia 11th | 1,071.25 | 2,774.54 |
| 262 | North Carolina 4th | 1,045.35 | 2,707.46 |
| 263 | Texas 22nd | 1,032.84 | 2,675.06 |
| 264 | Washington 2nd | 1,015.02 | 2,628.90 |
| 265 | Virginia 2nd | 991.68 | 2,568.45 |
| 266 | New Jersey 5th | 991.30 | 2,567.47 |
| 267 | New Jersey 7th | 970.19 | 2,512.79 |
| 268 | Virginia 3rd | 947.10 | 2,452.99 |
| 269 | California 26th | 939.12 | 2,432.32 |
| 270 | California 42nd | 935.96 | 2,424.14 |
| 271 | California 19th | 915.34 | 2,370.73 |
| 272 | Pennsylvania 6th | 912.84 | 2,364.25 |
| 273 | Texas 26th | 907.15 | 2,349.52 |
| 274 | New Jersey 3rd | 899.70 | 2,330.23 |
| 275 | Ohio 13th | 894.30 | 2,316.24 |
| 276 | Florida 12th | 883.75 | 2,288.91 |
| 277 | Pennsylvania 17th | 882.88 | 2,286.64 |
| 278 | Florida 16th | 875.33 | 2,267.11 |
| 279 | Pennsylvania 7th | 856.64 | 2,218.68 |
| 280 | Maryland 8th | 859.85 | 2,227.01 |
| 281 | North Carolina 9th | 856.93 | 2,219.45 |
| 282 | Washington 10th | 826.67 | 2,141.08 |
| 283 | Florida 15th | 818.51 | 2,119.94 |
| 284 | Rhode Island 2nd | 765.32 | 1,982.18 |
| 285 | Massachusetts 3rd | 757.86 | 1,962.86 |
| 286 | Kansas 3rd | 757.20 | 1,961.15 |
| 287 | Florida 19th | 750.37 | 1,943.46 |
| 288 | Georgia 13th | 714.95 | 1,851.72 |
| 289 | Texas 16th | 710.35 | 1,839.81 |
| 290 | California 27th | 699.90 | 1,812.74 |
| 291 | California 18th | 696.12 | 1,802.95 |
| 292 | New Jersey 4th | 691.88 | 1,791.97 |
| 293 | Ohio 1st | 686.96 | 1,779.23 |
| 294 | Connecticut 1st | 675.45 | 1,749.42 |
| 295 | Massachusetts 4th | 668.27 | 1,730.82 |
| 296 | New York 1st | 650.02 | 1,683.55 |
| 297 | Pennsylvania 1st | 638.39 | 1,653.44 |
| 298 | Arizona 6th | 625.07 | 1,618.93 |
| 299 | California 15th | 599.45 | 1,552.58 |
| 300 | Texas 35th | 593.77 | 1,537.87 |
| 301 | California 49th | 553.08 | 1,432.48 |
| 302 | North Carolina 12th | 441 | 1,143.4 |
| 303 | California 7th | 548.65 | 1,421.00 |
| 304 | Arizona 8th | 539.66 | 1,397.72 |
| 305 | Minnesota 3rd | 527.05 | 1,365.06 |
| 306 | Massachusetts 6th | 526.79 | 1,364.39 |
| 307 | Florida 7th | 513.58 | 1,330.17 |
| 308 | New York 25th | 510.19 | 1,321.39 |
| 309 | Nebraska 2nd | 509.74 | 1,320.23 |
| 310 | New Jersey 11th | 504.97 | 1,307.87 |
| 311 | Georgia 4th | 496.6 | 1,286.20 |
| 312 | California 11th | 493.61 | 1,278.45 |
| 313 | Maryland 7th | 488.03 | 1,264.00 |
| 314 | Tennessee 9th | 483.39 | 1,251.98 |
| 315 | Texas 3rd | 480.88 | 1,245.48 |
| 316 | Pennsylvania 4th | 477.02 | 1,235.48 |
| 317 | Colorado 6th | 474.66 | 1,229.37 |
| 318 | Connecticut 3rd | 470.34 | 1,218.18 |
| 319 | Missouri 2nd | 465.76 | 1,206.32 |
| 320 | Ohio 9th | 464.65 | 1,203.44 |
| 321 | Connecticut 4th | 460.73 | 1,193.29 |
| 322 | Michigan 11th | 419.26 | 1,085.88 |
| 323 | New Jersey 12th | 412.23 | 1,067.68 |
| 324 | Michigan 12th | 403.21 | 1,044.31 |
| 325 | Georgia 7th | 392.61 | 1,016.86 |
| 326 | New York 17th | 382.63 | 991.01 |
| 327 | Illinois 6th | 378.78 | 981.04 |
| 328 | Texas 30th | 356.27 | 922.74 |
| 329 | New Jersey 1st | 350.02 | 906.55 |
| 330 | Maryland 2nd | 348.88 | 903.6 |
| 331 | Colorado 7th | 342.11 | 886.07 |
| 332 | Minnesota 4th | 332.49 | 861.15 |
| 333 | California 45th | 330.39 | 855.71 |
| 334 | Massachusetts 8th | 326.37 | 845.3 |
| 335 | Kentucky 3rd | 319.34 | 827.09 |
| 336 | California 41st | 316.54 | 819.84 |
| 337 | Texas 2nd | 308.75 | 799.66 |
| 338 | Maryland 3rd | 304.14 | 787.72 |
| 339 | Indiana 7th | 303.84 | 786.95 |
| 340 | Illinois 10th | 299.78 | 776.43 |
| 341 | Georgia 6th | 298.76 | 773.79 |
| 342 | Maryland 4th | 297.81 | 771.33 |
| 343 | Arizona 5th | 293.47 | 760.09 |
| 344 | Pennsylvania 18th | 292.54 | 757.68 |
| 345 | California 33rd | 288.58 | 747.42 |
| 346 | Illinois 11th | 280.95 | 727.66 |
| 347 | Rhode Island 1st | 268.49 | 695.39 |
| 348 | California 52nd | 267 | 691.53 |
| 349 | Florida 14th | 265.4 | 687.39 |
| 350 | Massachusetts 5th | 265.08 | 686.56 |
| 351 | Georgia 5th | 264.91 | 686.12 |
| 352 | Texas 24th | 262.76 | 680.55 |
| 353 | Florida 21st | 260.97 | 675.91 |
| 354 | California 14th | 259.5 | 672.11 |
| 355 | Illinois 1st | 258.38 | 669.2 |
| 356 | New York 3rd | 254.92 | 660.24 |
| 357 | Ohio 11th | 244.46 | 633.15 |
| 358 | Illinois 3rd | 237.18 | 614.3 |
| 359 | Texas 18th | 235.2 | 609.17 |
| 360 | Ohio 3rd | 228 | 590.52 |
| 361 | Missouri 1st | 225.36 | 583.68 |
| 362 | New York 26th | 219.13 | 567.55 |
| 363 | California 28th | 218.45 | 565.79 |
| 364 | California 31st | 218.24 | 565.24 |
| 365 | California 47th | 216.21 | 559.98 |
| 366 | New Jersey 6th | 215.55 | 558.28 |
| 367 | Texas 33rd | 211.94 | 548.93 |
| 368 | Pennsylvania 5th | 211.74 | 548.40 |
| — | Guam at-large | 210 | 540 |
| 369 | Hawaii 1st | 209.22 | 541.88 |
| 370 | Florida 27th | 208.84 | 540.9 |
| 371 | Illinois 8th | 205.52 | 532.3 |
| 372 | Arizona 7th | 205.12 | 531.26 |
| 373 | California 39th | 204.4 | 529.4 |
| 374 | Texas 20th | 199.68 | 517.17 |
| 375 | Colorado 1st | 189.62 | 491.12 |
| 376 | Texas 29th | 187.07 | 484.51 |
| 377 | Florida 13th | 186.03 | 481.82 |
| 378 | Michigan 14th | 185.73 | 481.04 |
| 379 | Texas 32nd | 185.66 | 480.86 |
| 380 | Virginia 11th | 185.09 | 479.38 |
| 381 | California 17th | 184.85 | 478.76 |
| 382 | Michigan 13th | 184.85 | 478.76 |
| 383 | Michigan 9th | 183.59 | 475.5 |
| 384 | Washington 9th | 183.43 | 475.08 |
| 385 | New York 2nd | 182.01 | 471.41 |
| — | N. Mariana Islands at-large | 179 | 460 |
| 386 | California 6th | 175.04 | 453.35 |
| 387 | Florida 22nd | 172.88 | 447.76 |
| 388 | Florida 23rd | 169.1 | 437.97 |
| 389 | California 35th | 168.88 | 437.4 |
| 390 | Texas 9th | 165.64 | 429.01 |
| 391 | Arizona 9th | 164.79 | 426.81 |
| 392 | Texas 7th | 161.94 | 419.43 |
| 393 | Virginia 8th | 149.24 | 386.53 |
| 394 | California 48th | 145.47 | 376.77 |
| 395 | Washington 7th | 144.13 | 373.3 |
| 396 | California 30th | 135.94 | 352.08 |
| 397 | Minnesota 5th | 135.66 | 351.36 |
| 398 | California 53rd | 135.43 | 350.76 |
| — | US Virgin Islands at-large | 133.7 | 346 |
| 399 | Wisconsin 4th | 128.35 | 332.43 |
| 400 | California 32nd | 124.23 | 321.76 |
| 401 | New York 4th | 110.85 | 287.1 |
| 402 | Florida 24th | 106.08 | 274.75 |
| 403 | Illinois 9th | 91.85 | 237.89 |
| 404 | Nevada 1st | 104.5 | 270.66 |
| 405 | California 38th | 101.46 | 262.78 |
| 406 | California 13th | 96.79 | 250.69 |
| 407 | Illinois 5th | 95.71 | 247.89 |
| 408 | New Jersey 9th | 95.34 | 246.93 |
| 409 | California 29th | 92.03 | 238.26 |
| 410 | California 44th | 79.36 | 205.46 |
| 411 | New York 16th | 78.37 | 202.98 |
| — | American Samoa at-large | 77 | 200 |
| 412 | New Jersey 10th | 75.92 | 196.63 |
| 413 | California 43rd | 72.03 | 186.56 |
| 414 | California 46th | 71.72 | 185.75 |
| 415 | New York 11th | 65.83 | 170.5 |
| 416 | Massachusetts 7th | 62.67 | 162.32 |
| 417 | Pennsylvania 2nd | 62.64 | 162.25 |
| 418 | Illinois 7th | 62.52 | 161.93 |
| — | District of Columbia at-large | 61.40 | 159.03 |
| 419 | California 40th | 57.69 | 149.42 |
| 420 | California 37th | 55.26 | 143.12 |
| 421 | New Jersey 8th | 54.69 | 141.65 |
| 422 | Pennsylvania 3rd | 52.78 | 136.70 |
| 423 | Illinois 4th | 52.45 | 135.85 |
| 424 | New York 5th | 51.88 | 134.37 |
| 425 | California 34th | 47.66 | 123.44 |
| 426 | California 12th | 38.97 | 100.93 |
| 427 | New York 6th | 29.78 | 77.13 |
| 428 | New York 8th | 29.66 | 76.82 |
| 429 | New York 14th | 28.29 | 73.27 |
| 430 | New York 7th | 16.16 | 41.85 |
| 431 | New York 9th | 15.54 | 40.25 |
| 432 | New York 12th | 14.79 | 38.31 |
| 433 | New York 15th | 14.54 | 37.66 |
| 434 | New York 10th | 14.25 | 36.91 |
| 435 | New York 13th | 10.25 | 26.55 |
另見 编辑
參考資料 编辑
- ^ About Congressional Districts. U.S. Census Bureau. [2021-5-22].
- ^ U.S. Senete: House of Representatives. U.S. Senete. [2020-5-22].
- ^ Drew DeSilver. U.S. population keeps growing, but House of Representatives is same size as in Taft era. Pew Research Center. [2021-5-22].
- ^ 4.0 4.1 4.2 4.3 Maine used to be part of Massachusetts. After the 1810 census, Massachusetts was allocated 20 districts. Seven districts (numbers 14 through 20) were credited to Maine soon after it became a state in 1820.
- ^ North Carolina General Assembly - 2016 Contingent Congressional Plan - Corrected*. ncleg.net. [8 May 2018]. (原始内容存档于12 January 2018).
- ^ Geography, US Census Bureau. Congressional Districts Relationship Files (state-based). census.gov. [8 May 2018]. (原始内容存档于17 July 2017).
- ^ Index of /geo/maps/cong_dist/cd116/cd_based/ST42. www2.census.gov. [2019-05-16].
- United States Census 2010. U.S. Census Bureau. [October 25, 2013].
- Martis, Kenneth C. The Historical Atlas of Political Parties in the United States Congress, 1789–1989. Macmillan Publishing. 1989. ISBN 0029201705.
外部連結 编辑
| 维基共享资源上的相关多媒体资源:ATannedBurger/沙盒/美國國會選區列表 |
- Find a Senator or Representative via Govtrack.us
- United States Census Bureau:
- National Atlas Printable District Maps
- Jeffrey B. Lewis; et al. Digital Boundary Definitions of United States Congressional Districts, 1789–2012. University of California, Los Angeles. 2013.