File:2007 Pacific typhoon season summary.jpg

本预览的尺寸:800 × 570像素。 其他分辨率:320 × 228像素 | 640 × 456像素 | 1,024 × 729像素 | 1,280 × 911像素 | 1,871 × 1,332像素。
原始文件 (1,871 × 1,332像素,文件大小:331 KB,MIME类型:image/jpeg)
| 描述 |
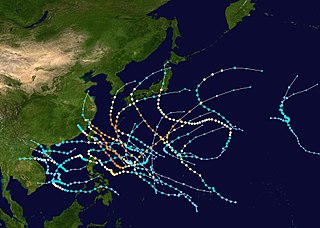
English: This map shows the tracks of all tropical cyclones in the 2007 Pacific typhoon season. The points show the location of each storm at 6-hour intervals. The colour represents the storm's maximum sustained wind speeds as classified in the Saffir-Simpson Hurricane Scale (see below), and the shape of the data points represent the type of the storm.
Tropical depression (≤38 mph, ≤62 km/h)
Tropical storm (39–73 mph, 63–118 km/h)
Category 1 (74–95 mph, 119–153 km/h)
Category 2 (96–110 mph, 154–177 km/h)
Category 3 (111–129 mph, 178–208 km/h)
Category 4 (130–156 mph, 209–251 km/h)
Category 5 (≥157 mph, ≥252 km/h)
Unknown
Storm type |
| 来源 | Created using Wikipedia:WikiProject Tropical cyclones/Tracks. The background image is from NASA [1]. The tracking data is from the Joint Typhoon Warning Center's best track database |
| 作者 | Potapych |

|
该文件可能会更新以反映新信息 如果您希望在不镜像新更新的情况下使用该文件的特定版本,请将所需版本作为单独的文件上传。 |
| 本作品已被作者Potapych释出到公有领域。这适用于全世界。 在一些国家这可能不合法;如果是这样的话,那么: Potapych无条件地授予任何人以任何目的使用本作品的权利,除非这些条件是法律规定所必需的。 |
文件历史
点击某个日期/时间查看对应时刻的文件。
| 日期/时间 | 缩略图 | 大小 | 用户 | 备注 | |
|---|---|---|---|---|---|
| 当前 | 2017年9月19日 (二) 02:47 | | 1,871 × 1,332(331 KB) | Typhoon2013 | rv just for colour until someone can update the map with extra TDs and minor fixes |
| 2008年12月16日 (二) 18:02 |  | 3,000 × 1,900(684 KB) | Potapych | trying a different one | |
| 2008年12月16日 (二) 16:47 |  | 3,000 × 1,900(708 KB) | Potapych | larger version | |
| 2008年11月28日 (五) 01:30 |  | 1,871 × 1,332(331 KB) | Ramisses | This map shows the tracks of all tropical cyclones in the 2007 Pacific typhoon season. {{PD-user|Ramisses}} Category:Pacific typhoon season track maps <!--{{ImageUpload|basic}}--> |
文件用途
以下21个页面使用本文件:
全域文件用途
以下其他wiki使用此文件:
- ko.wikipedia.org上的用途
- zh-yue.wikipedia.org上的用途