File:2015-2016 Australian region cyclone season summary.png
本预览的尺寸:800 × 571像素。 其他分辨率:320 × 229像素 | 640 × 457像素 | 1,024 × 731像素 | 1,280 × 914像素 | 2,560 × 1,828像素 | 4,000 × 2,857像素。
原始文件 (4,000 × 2,857像素,文件大小:5.39 MB,MIME类型:image/png)
| 描述 |
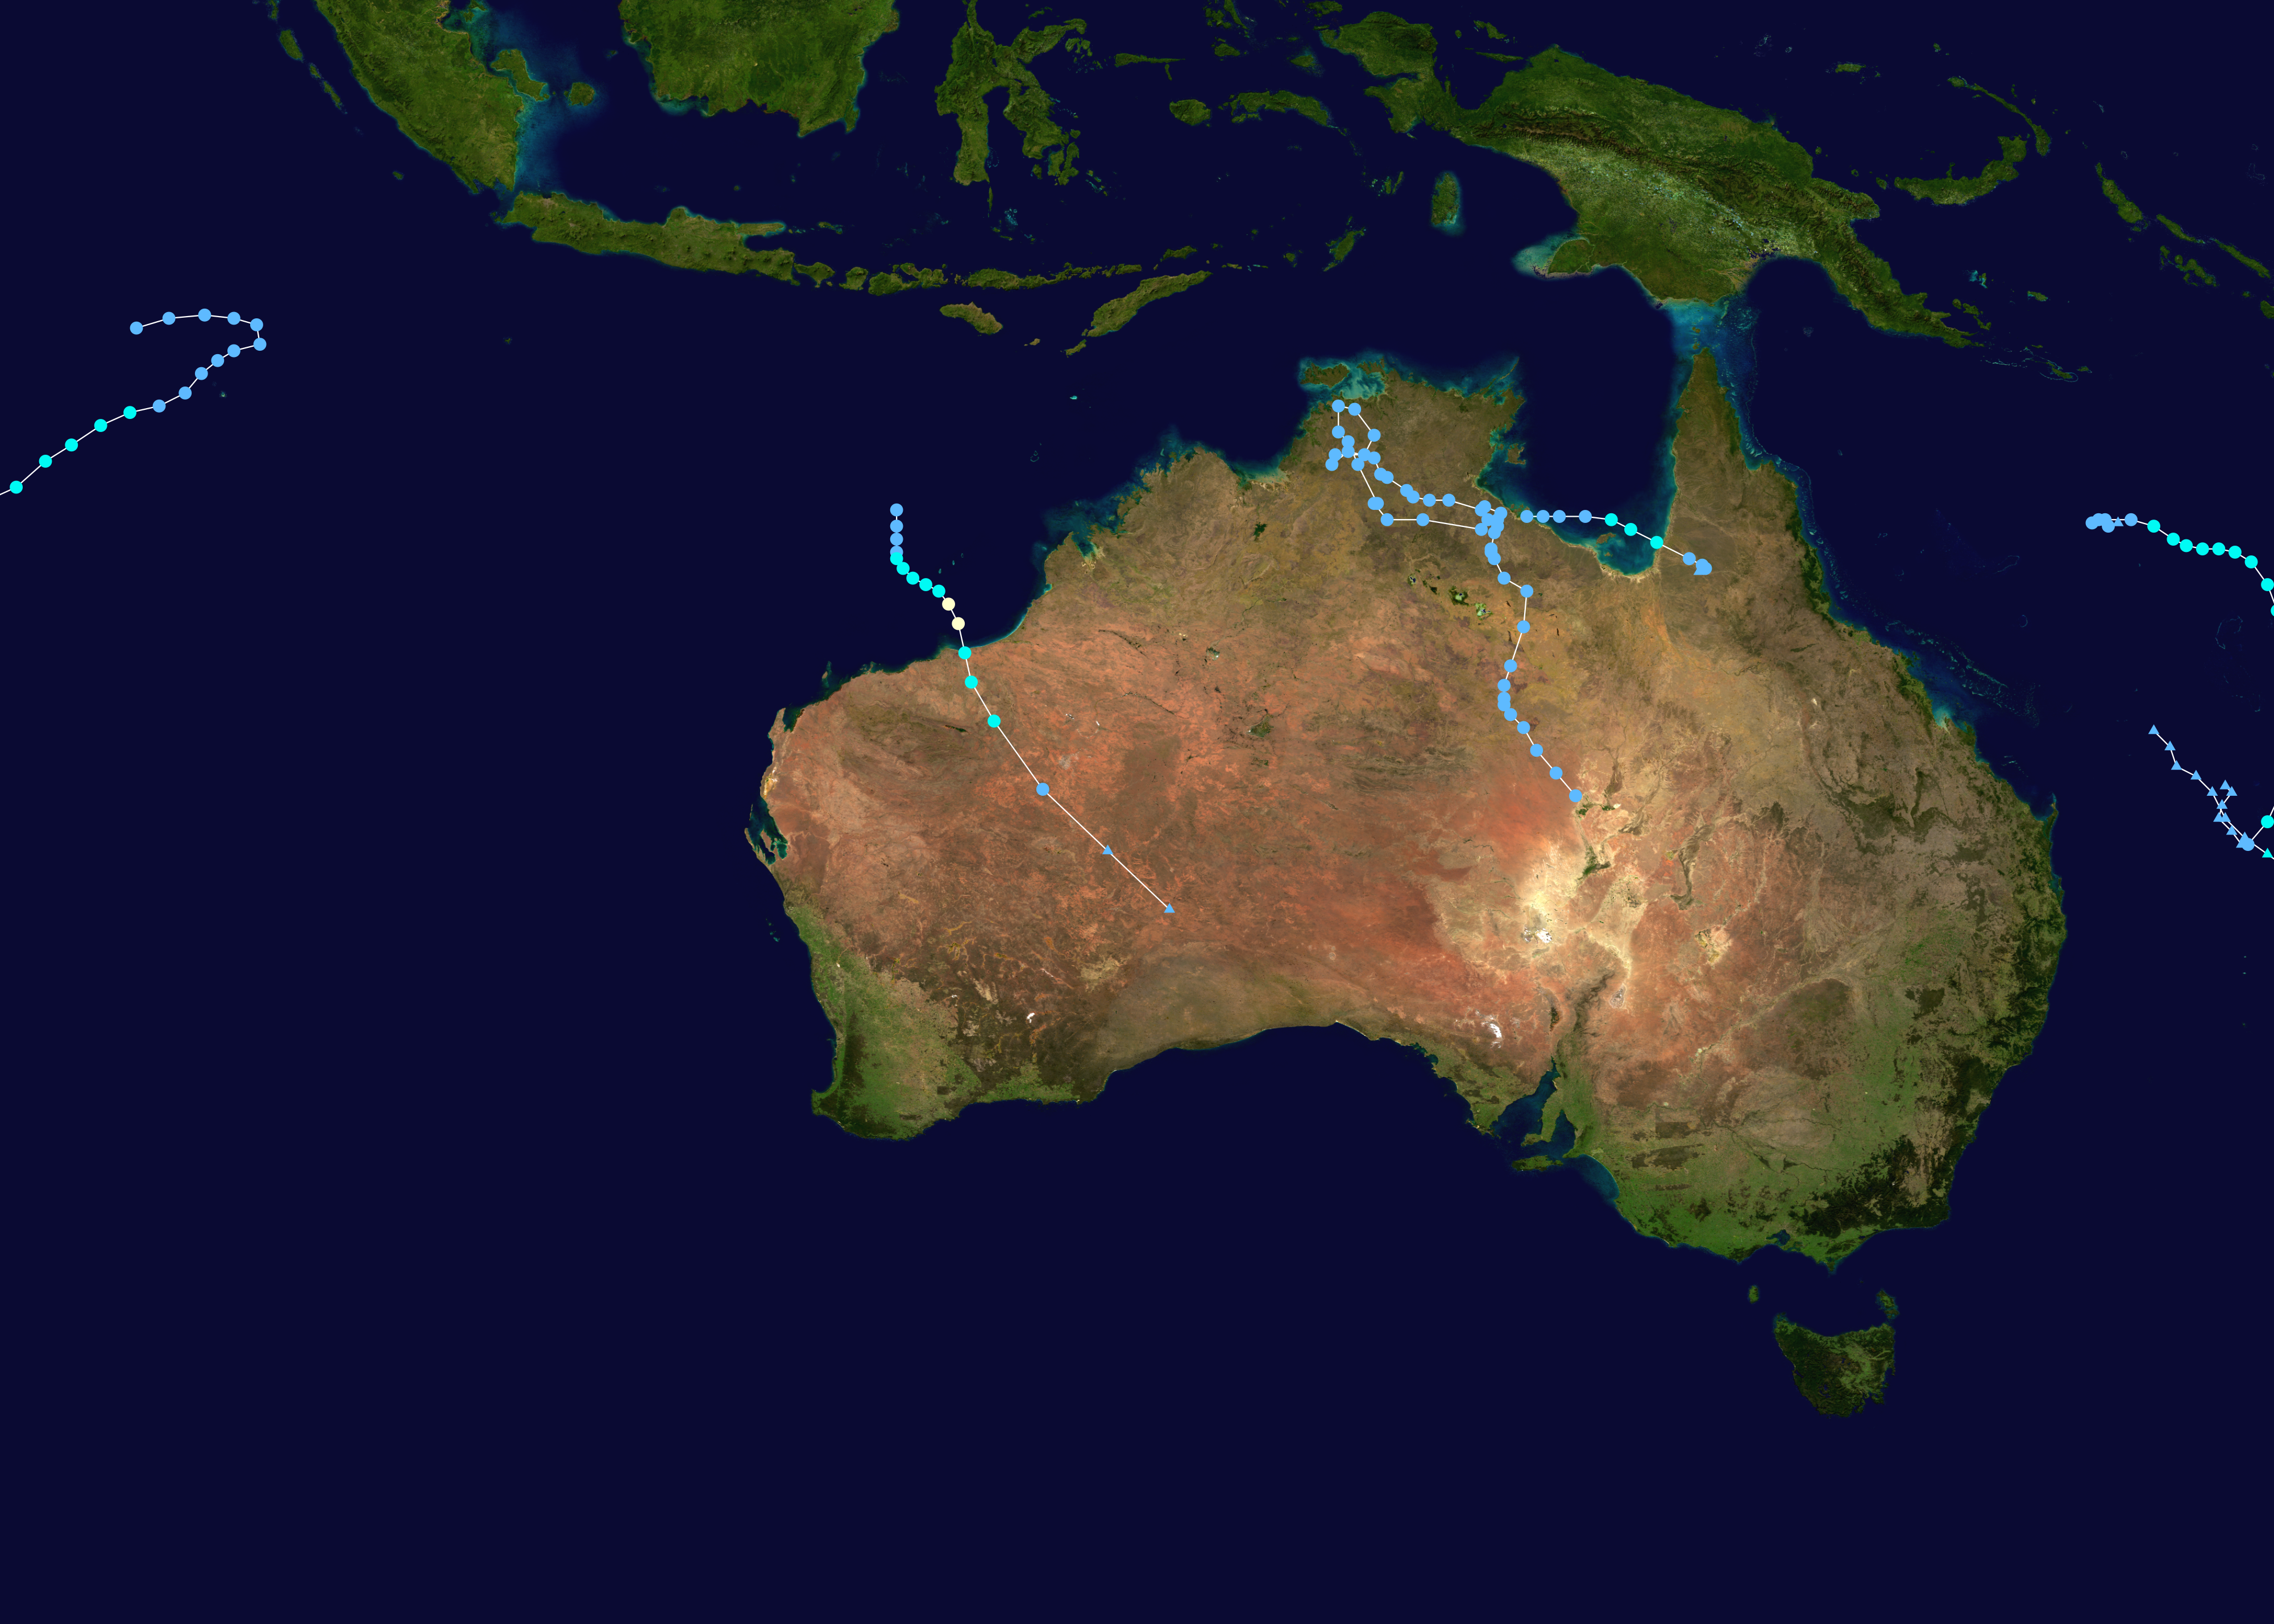
English: This map shows the tracks of all tropical cyclones in the 2015-16 Australian region cyclone season. The points show the location of each storm at 6-hour intervals. The colour represents the storm's maximum sustained wind speeds as classified in the Saffir-Simpson Hurricane Scale (see below), and the shape of the data points represent the type of the storm.
Tropical depression (≤38 mph, ≤62 km/h)
Tropical storm (39–73 mph, 63–118 km/h)
Category 1 (74–95 mph, 119–153 km/h)
Category 2 (96–110 mph, 154–177 km/h)
Category 3 (111–129 mph, 178–208 km/h)
Category 4 (130–156 mph, 209–251 km/h)
Category 5 (≥157 mph, ≥252 km/h)
Unknown
Storm type |
| 来源 | Created using Wikipedia:WikiProject Tropical cyclones/Tracks. The background image is from NASA [1]. The tracking data is from the Joint Typhoon Warning Center's best track database |
| 作者 | Keith Edkins |
| 本作品已被作者Keith Edkins释出到公有领域。这适用于全世界。 在一些国家这可能不合法;如果是这样的话,那么: Keith Edkins无条件地授予任何人以任何目的使用本作品的权利,除非这些条件是法律规定所必需的。 |
文件历史
点击某个日期/时间查看对应时刻的文件。
| 日期/时间 | 缩略图 | 大小 | 用户 | 备注 | |
|---|---|---|---|---|---|
| 当前 | 2020年2月21日 (五) 07:58 | | 4,000 × 2,857(5.39 MB) | Supportstorm | Best track update |
| 2016年3月7日 (一) 04:00 |  | 4,000 × 2,472(6.25 MB) | Cyclonebiskit | Update; remove Ex-Stan portion that's not official | |
| 2016年2月19日 (五) 03:02 |  | 4,000 × 2,472(6.25 MB) | Cyclonebiskit | Update | |
| 2016年1月18日 (一) 18:04 |  | 3,000 × 1,854(3.43 MB) | Keith Edkins | {{Hurricane season auto track map|start=|end=|source=JTWC|type=cyclone|basin=Australian region|year=2015-16|author=Keith Edkins}} |
文件用途
以下2个页面使用本文件:
全域文件用途
以下其他wiki使用此文件:
- en.wikipedia.org上的用途
- ko.wikipedia.org上的用途
- pt.wikipedia.org上的用途
- th.wikipedia.org上的用途