File:20201210 Antarctica ice mass variation - NASA GRACE-en.svg

此SVG文件的PNG预览的大小:800 × 600像素。 其他分辨率:320 × 240像素 | 640 × 480像素 | 1,024 × 768像素 | 1,280 × 960像素 | 2,560 × 1,920像素 | 1,000 × 750像素。
原始文件 (SVG文件,尺寸为1,000 × 750像素,文件大小:5 KB)
摘要
| 描述 |
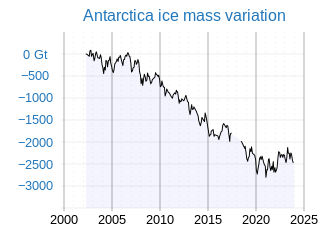
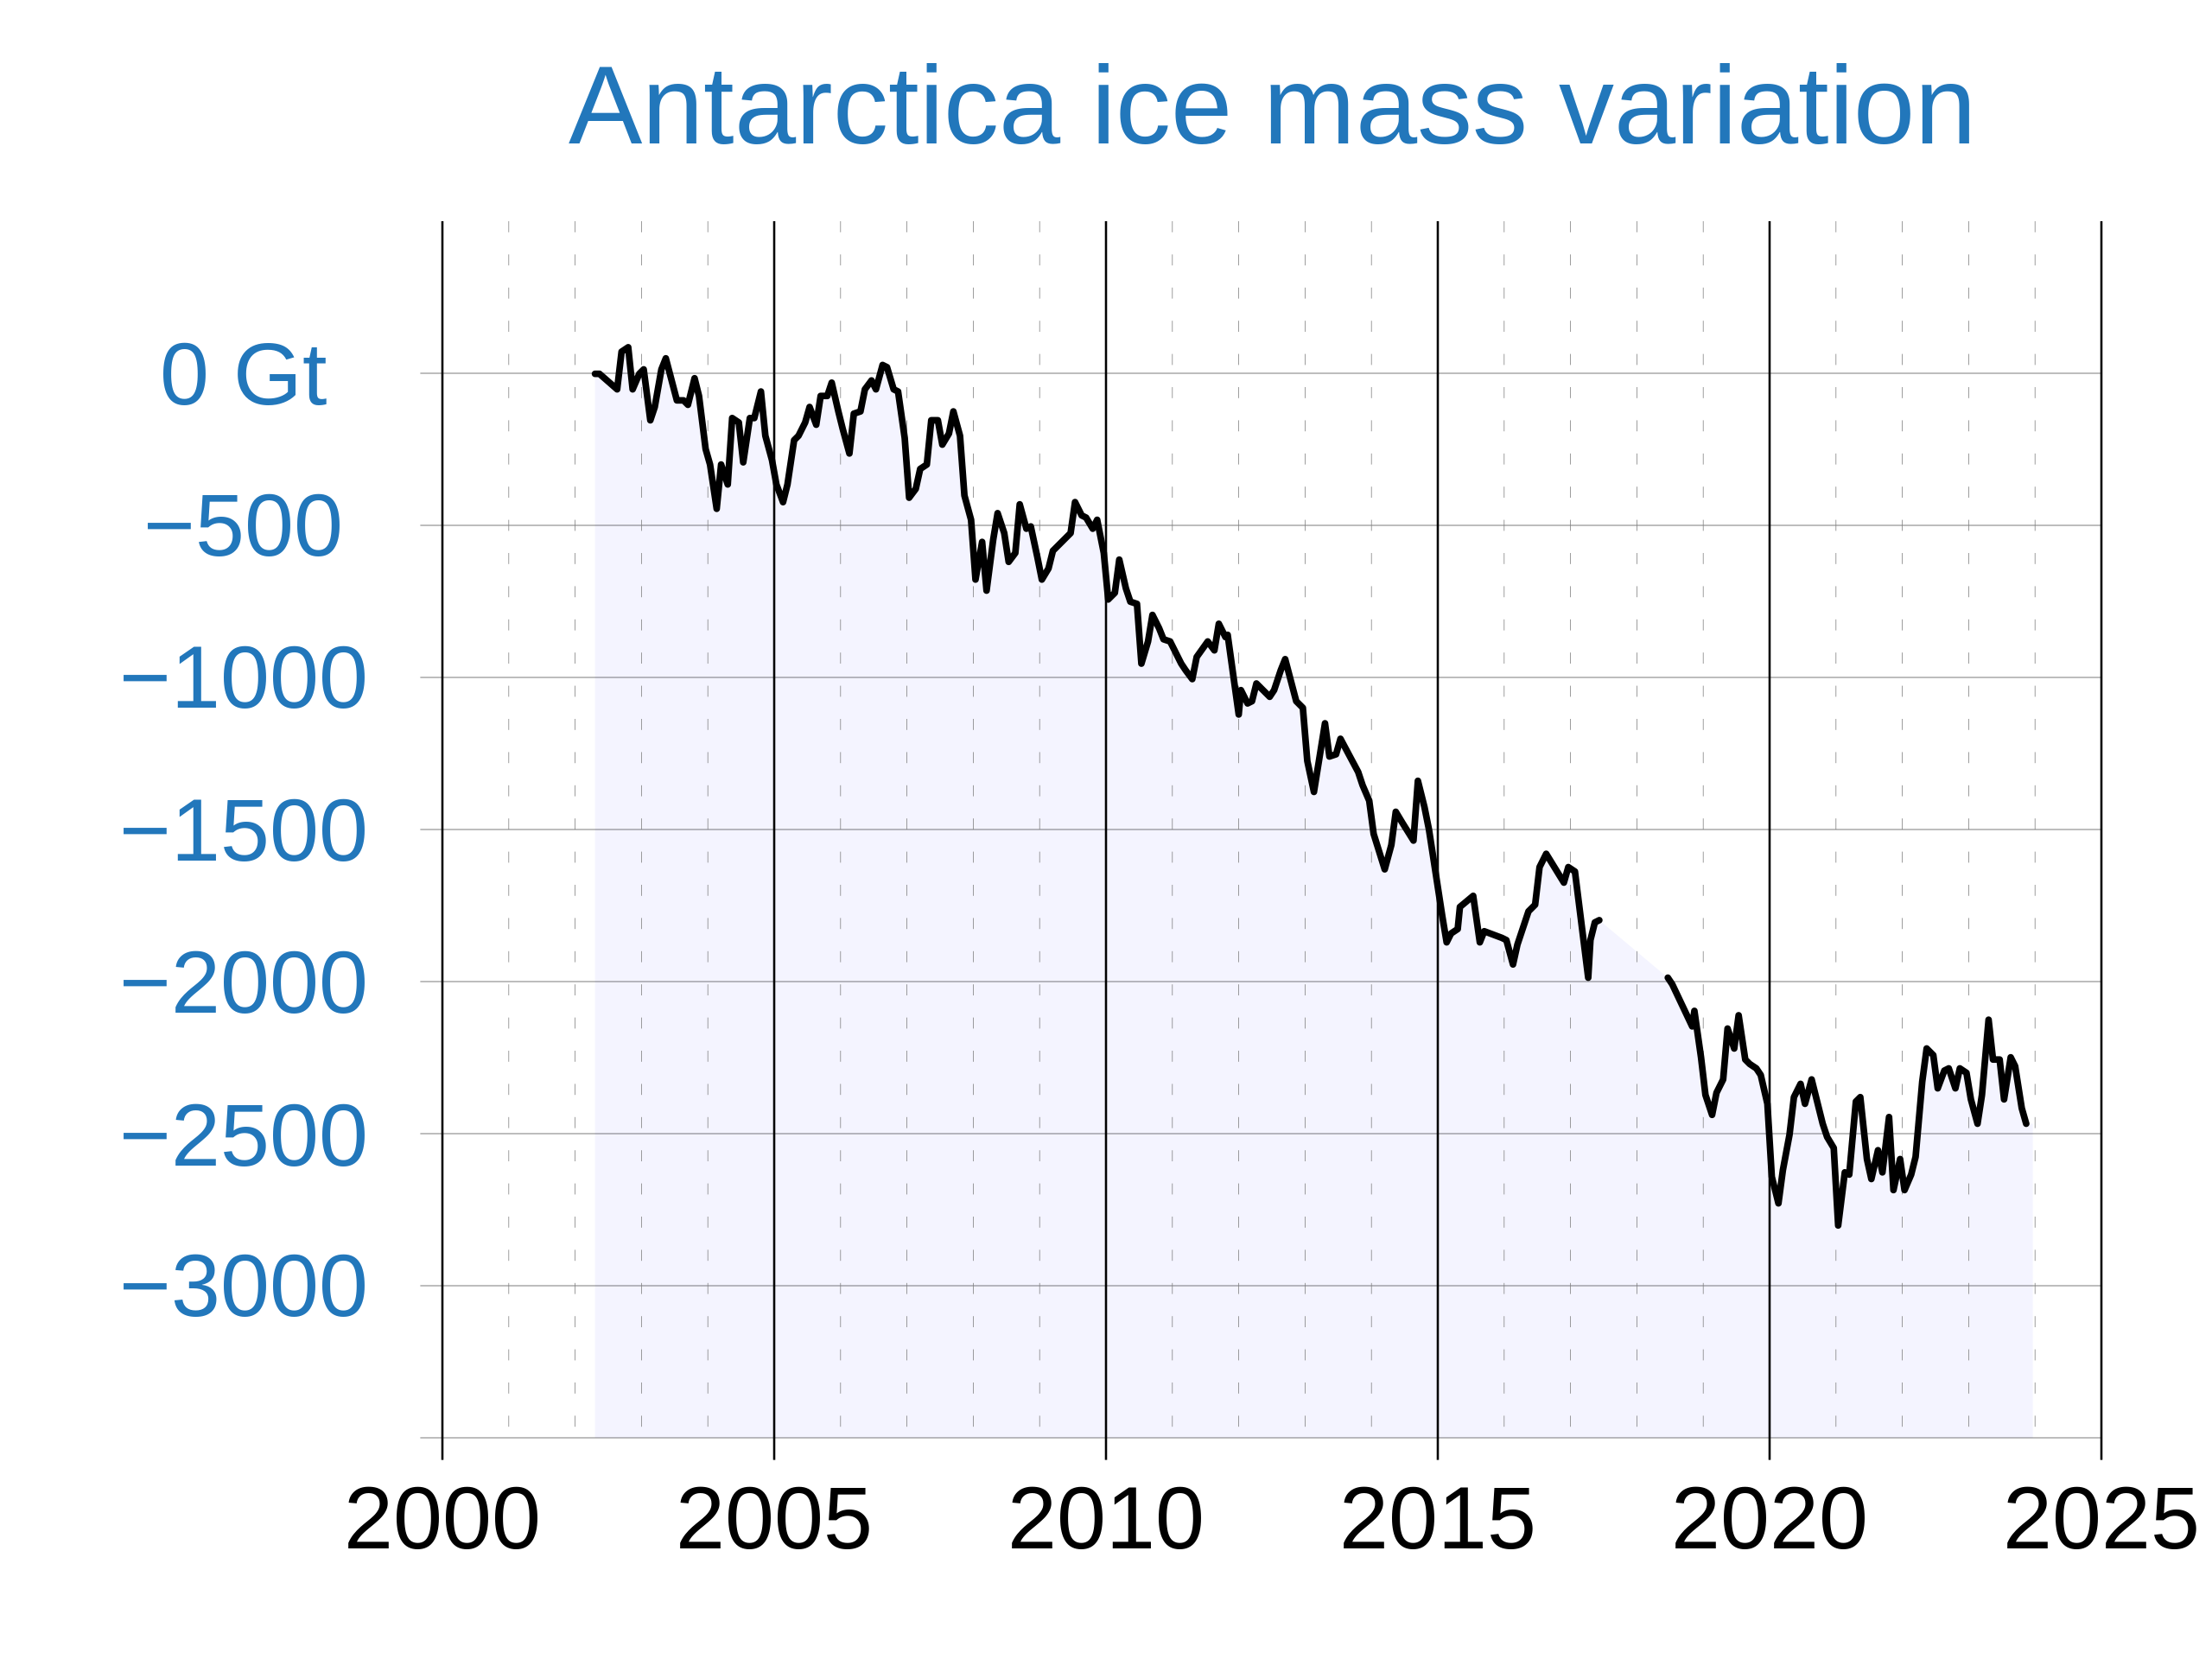
English: From source: "Ice mass measurement by NASA's GRACE satellites. Gap represents time between missions. Credit: NASA" (includes data from GRACE AND GRACE follow-on)
|
| 日期 | |
| 来源 |
|
| 作者 | Employee(s) of NASA, U.S. government, in the ordinary course of their employment duties. |
许可协议
1. For the NASA work:
| 本文件完全由NASA创作,在美国属于公有领域。根据NASA的版权方针,NASA的材料除非另有声明否则不受版权保护。(参见Template:PD-USGov/zh、NASA版权方针页面或JPL图片使用方针。) | ||
 |
警告:
|
2. For uploader's SVG graphic:
我,本作品著作权人,特此采用以下许可协议发表本作品:
本文件采用知识共享署名-相同方式共享 4.0 国际许可协议授权。
- 您可以自由地:
- 共享 – 复制、发行并传播本作品
- 修改 – 改编作品
- 惟须遵守下列条件:
- 署名 – 您必须对作品进行署名,提供授权条款的链接,并说明是否对原始内容进行了更改。您可以用任何合理的方式来署名,但不得以任何方式表明许可人认可您或您的使用。
- 相同方式共享 – 如果您再混合、转换或者基于本作品进行创作,您必须以与原先许可协议相同或相兼容的许可协议分发您贡献的作品。
文件历史
点击某个日期/时间查看对应时刻的文件。
| 日期/时间 | 缩略图 | 大小 | 用户 | 备注 | |
|---|---|---|---|---|---|
| 当前 | 2024年3月29日 (五) 22:24 | | 1,000 × 750(5 KB) | RCraig09 | Version 11: Updated with data through November 2023 |
| 2023年10月15日 (日) 04:13 |  | 1,000 × 750(5 KB) | RCraig09 | Version 10: update through June 2023 data . . . . add light blue area beneath trace | |
| 2023年2月2日 (四) 00:07 |  | 1,000 × 750(5 KB) | RCraig09 | Version 9: update to include data through late 2022 | |
| 2022年2月11日 (五) 18:32 |  | 1,000 × 750(5 KB) | RCraig09 | Version 8: changed gridlines per Talk Page . . . Colored title | |
| 2022年2月9日 (三) 15:40 |  | 1,000 × 750(49 KB) | Amitchell125 | thicker lines, text to path | |
| 2022年1月24日 (一) 06:16 |  | 1,000 × 750(4 KB) | RCraig09 | Version 6: implement suggestions from Talk Page, but keeping file size small and svg code simple | |
| 2022年1月22日 (六) 11:36 |  | 958 × 685(20 KB) | Femke | Hyphen -> minus signs. Remove various superfluous parts of graph, focussing on data | |
| 2022年1月22日 (六) 05:41 |  | 1,000 × 750(5 KB) | RCraig09 | Version 4: update to include data for 2021 . . . . use spreadsheet (not Inkscape) to generate SVG code that's more optimized for smaller file size . . . enlarge plot area to future-proof through 2024 | |
| 2022年1月15日 (六) 13:33 |  | 840 × 630(61 KB) | Amitchell125 | paths for objects | |
| 2021年2月20日 (六) 05:09 |  | 840 × 630(24 KB) | RCraig09 | Version 2: changed background shading so graph area is white and border is opaque light-gray |
文件用途
以下页面使用本文件:
全域文件用途
以下其他wiki使用此文件:
- ar.wikipedia.org上的用途
- el.wikipedia.org上的用途
- en.wikipedia.org上的用途
- id.wikipedia.org上的用途
- mk.wikipedia.org上的用途
- sl.wikipedia.org上的用途