File:Black body.svg

此SVG文件的PNG预览的大小:600 × 480像素。 其他分辨率:300 × 240像素 | 960 × 768像素 | 1,280 × 1,024像素 | 2,560 × 2,048像素。
原始文件 (SVG文件,尺寸为600 × 480像素,文件大小:20 KB)
摘要
| 描述 |
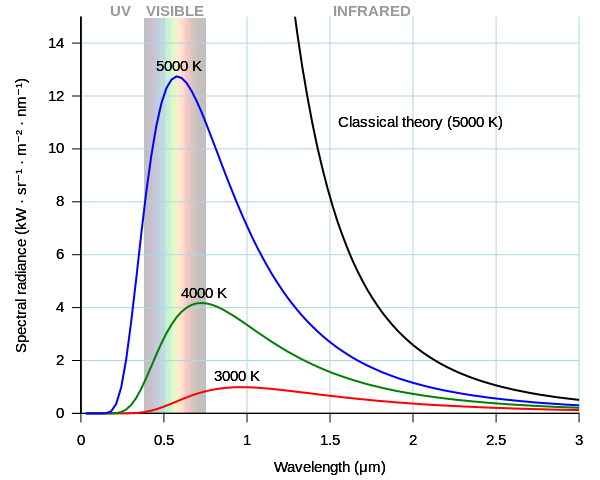
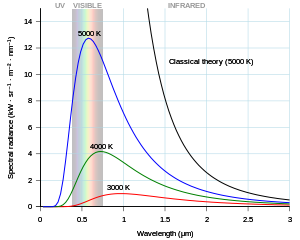
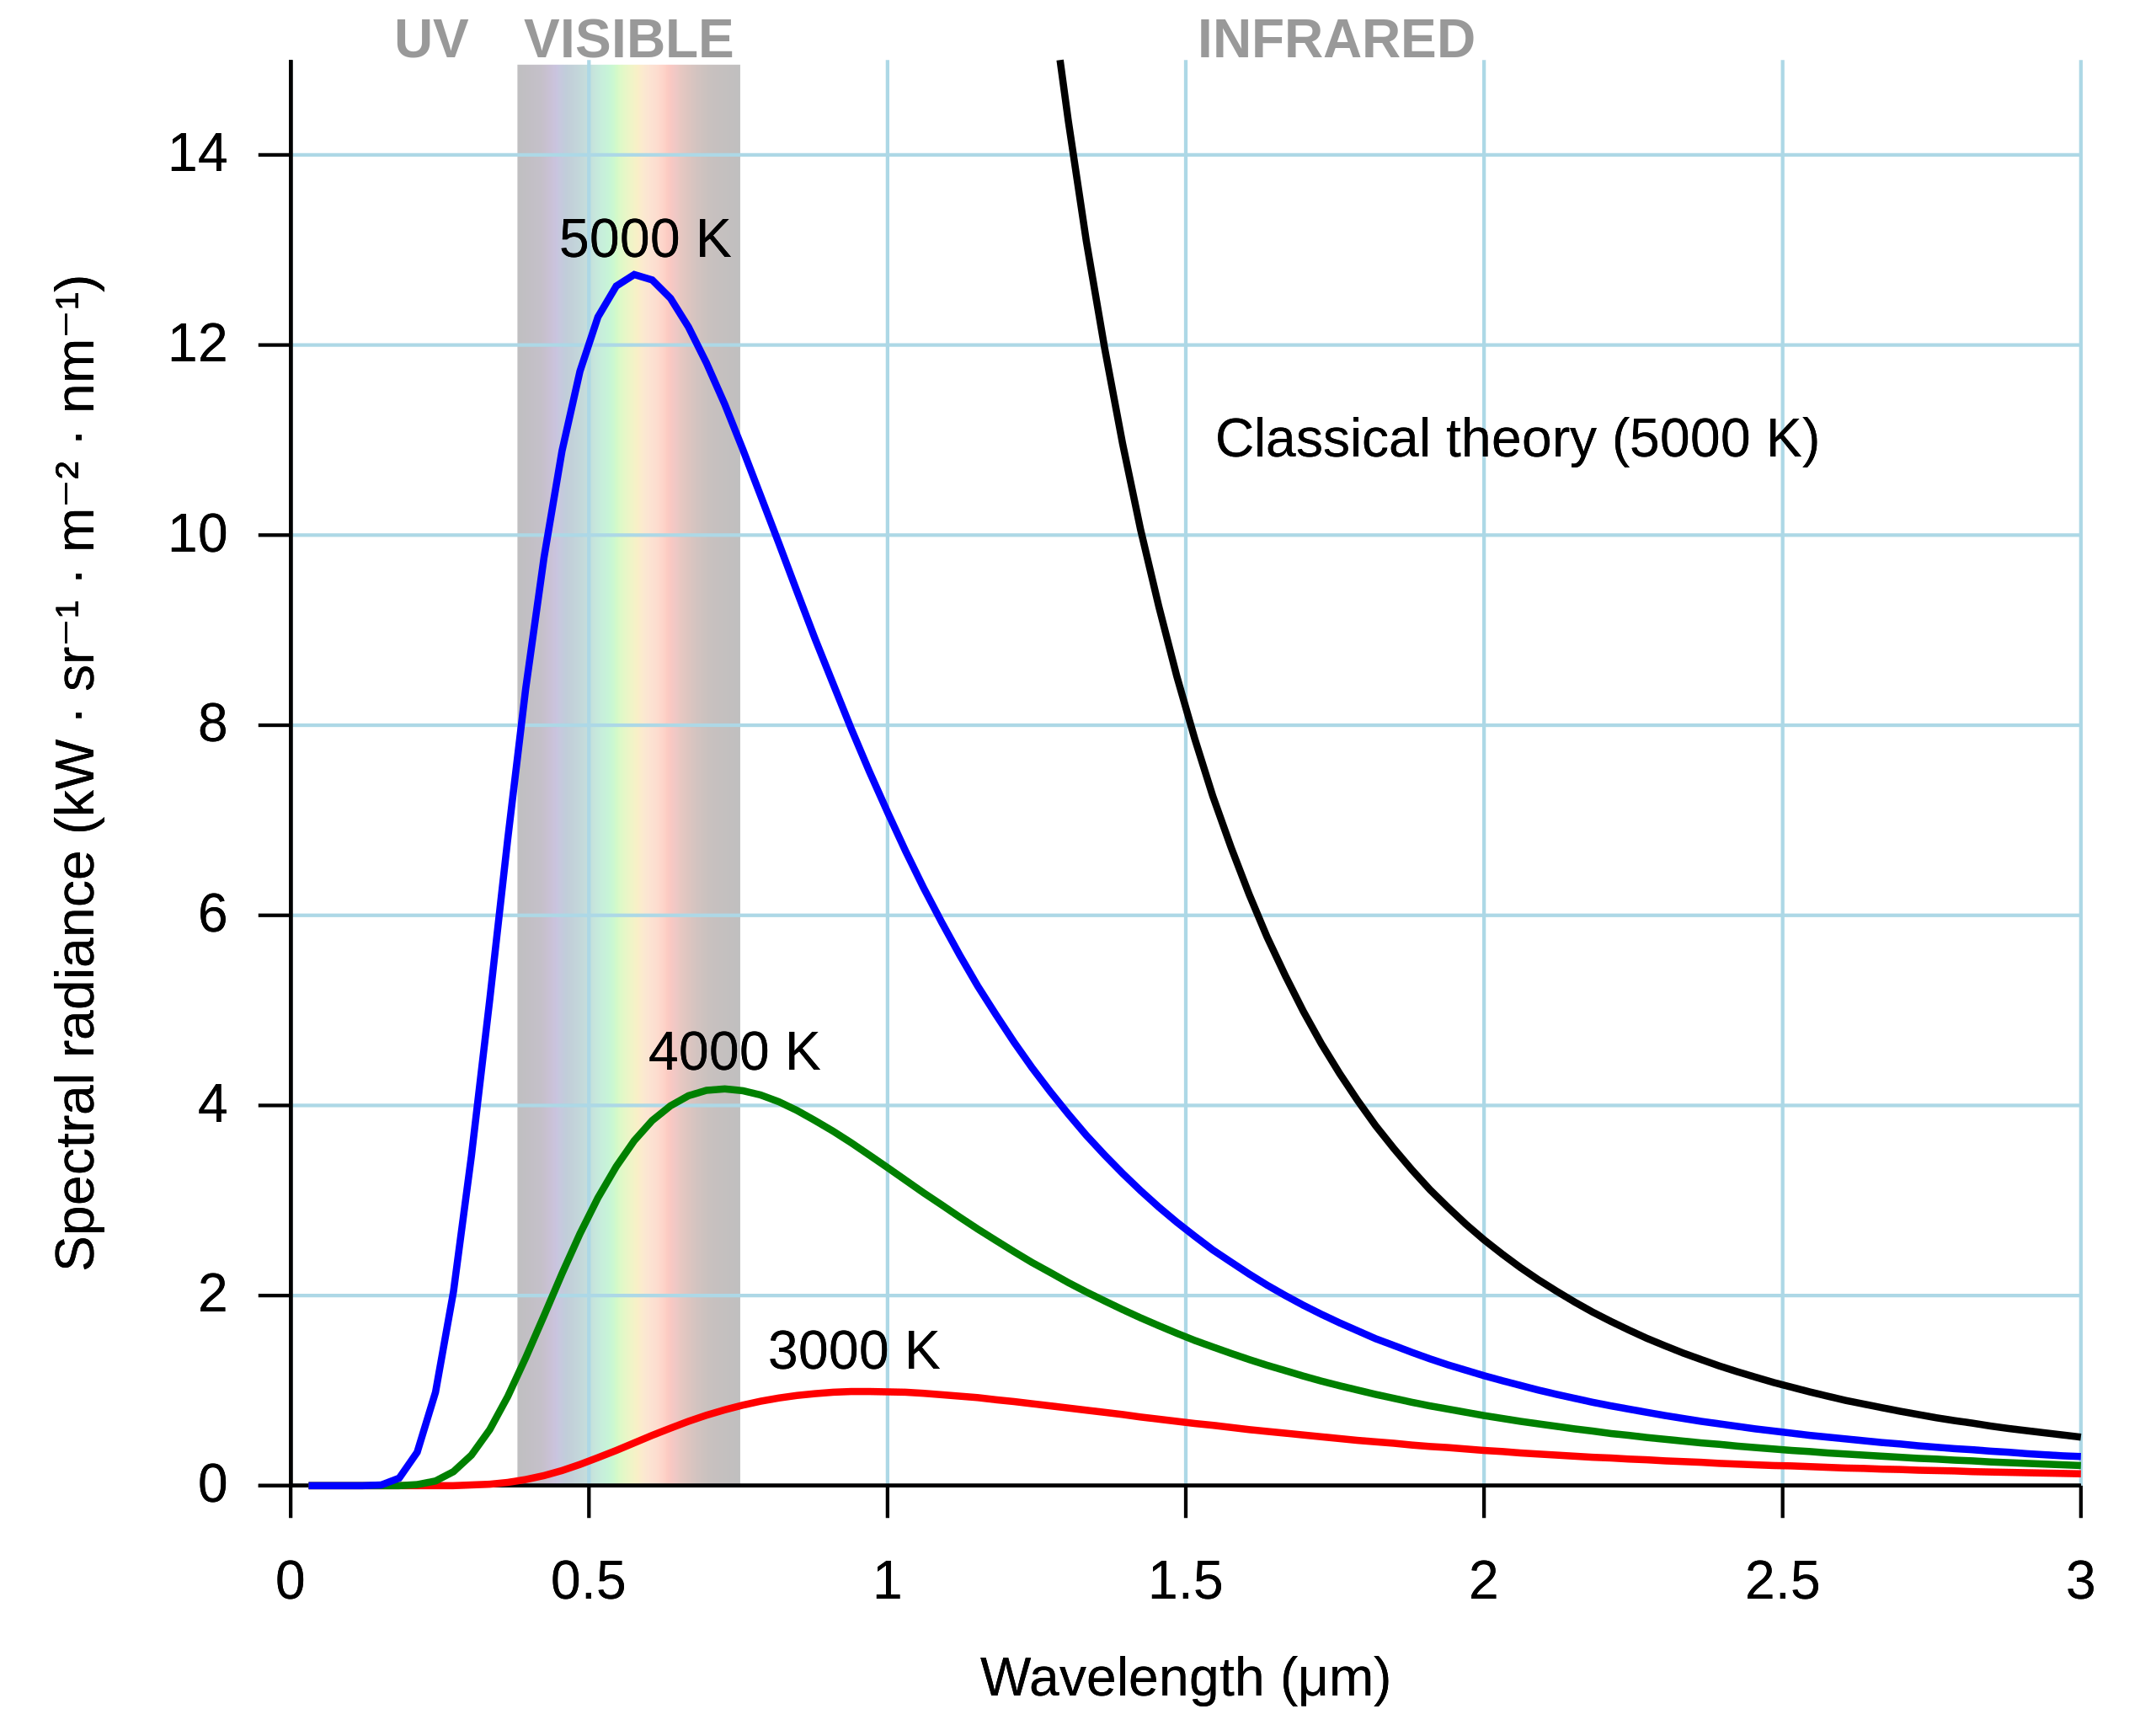
Català: Comparació entre les corbes de radiació espectral per a un cos negre segons la teoria de Planck i la teoria clàssica de Rayleigh-Jeans.
English: Black body spectral radiance curves for various temperatures after Planck, and comparison with the classical theory of Rayleigh-Jeans (in cgs units).
Italiano: Confronto fra le curve del corpo nero della teoria di Planck e della teoria classica di Rayleigh-Jeans. |
| 日期 | |
| 来源 | 自己的作品 |
| 作者 | Darth Kule |
| 其他版本 |
|
| SVG开发 | |
| 源代码 |
set term svg
set termoption enhanced
set encoding utf8
set output 'Black_body.svg'
unset key
set tics nomirror out
set border 3
set xrange [0:6]
set yrange [0:15]

set ylabel "Spectral radiance (kW • sr⁻¹ • m⁻² • nm⁻¹)"
set xlabel "Wavelength (μm)"
set label "5000 K" at 0.45,13.1
set label "4000 K" at 0.6,4.55
set label "3000 K" at 0.8,1.4
set label "Classical theory (5000 K)" at 1.55,11
set grid lc rgb "light-blue"

# length unit is micrometre
c=3e14 # speed of light
h=6.626e-22 # Planck constant
k=1.38e-11 # Boltzmann constant

# Planck curves
p1(x)=1e-6*2*h*c**2/(x**5*(exp(h*c/(x*k*3000))-1))
p2(x)=1e-6*2*h*c**2/(x**5*(exp(h*c/(x*k*4000))-1))
p3(x)=1e-6*2*h*c**2/(x**5*(exp(h*c/(x*k*5000))-1))
p4(x)=1e-6*2*h*c**2/(x**5*(exp(h*c/(x*k*6000))-1))

# Rayleigh-Jeans curve
rj(x)=1e-6*2*c*k*5000/(x**4)

plot p1(x) lw 2, p2(x) lw 2, p3(x) lw 2, p4(x) lw 2
plot rj(x) lw 2 lc rgb "black"\
|


许可协议
| 我,本作品著作权人,释出本作品至公有领域。这适用于全世界。 在一些国家这可能不合法;如果是这样的话,那么: 我无条件地授予任何人以任何目的使用本作品的权利,除非这些条件是法律规定所必需的。 |
所有翻译
Translations added to this section should be free of copyright claims (either CC0 or public domain).
- black body ≅ black body (Q161424)
- 黑体(Q161424)
- black body radiation ≅ black-body radiation (Q900097)
- 黑体辐射(Q900097)
- ultraviolet ≅ ultraviolet radiation (Q11391)
- 紫外線(Q11391)
- visible ≅ visible spectrum (Q76299)
- 可见光(Q76299)
- infrared ≅ infrared radiation (Q11388)
- 红外线(Q11388)
- wavelength ≅ wavelength (Q41364)
- 波长(Q41364)
- spectral radiance ≅ spectral radiant intensity in terms of wavelength (Q81072410)
- spectral radiant intensity in terms of wavelength(Q81072410)
- spectral radiance ≅ spectral radiant energy (Q80237041)
- spectral radiant energy(Q80237041)
- kelvin ≅ kelvin (Q11579)
- 开尔文(Q11579)
- μm、میکرومتر、µм、мкм、мкм、微米、µm、μm、μm、µm、µm
- K、К、K、K、K
文件历史
点击某个日期/时间查看对应时刻的文件。
| 日期/时间 | 缩略图 | 大小 | 用户 | 备注 | |
|---|---|---|---|---|---|
| 当前 | 2024年1月3日 (三) 03:48 | | 600 × 480(20 KB) | Glrx | remove #text nodes after tspan elements // Editing SVG source code using c:User:Rillke/SVGedit.js |
| 2023年9月30日 (六) 11:08 |  | 600 × 480(20 KB) | Townie | File uploaded using svgtranslate tool (https://svgtranslate.toolforge.org/). Added translation for ca. | |
| 2020年4月7日 (二) 11:28 |  | 600 × 480(15 KB) | GKFX | cleanup, move curves to foreground | |
| 2020年3月6日 (五) 14:21 |  | 600 × 480(33 KB) | Oz1sej | File uploaded using svgtranslate tool (https://tools.wmflabs.org/svgtranslate/). Added translation for da. | |
| 2020年3月6日 (五) 14:19 |  | 600 × 480(33 KB) | Oz1sej | File uploaded using svgtranslate tool (https://tools.wmflabs.org/svgtranslate/). Added translation for da. | |
| 2013年7月10日 (三) 17:06 |  | 600 × 480(30 KB) | Cmglee | Add visible spectrum. | |
| 2013年2月11日 (一) 00:18 |  | 600 × 480(26 KB) | Vaughan Pratt | "Spectral radiance" more standard than "Intensity" in ylabel; replaced "arb units" by actual units (kW per sq m per steradian per nm) | |
| 2010年9月18日 (六) 10:40 |  | 600 × 480(25 KB) | UncleDouggie | Restore the μ symbol in the axis label that I lost when generating the recent update. | |
| 2010年9月18日 (六) 10:03 |  | 600 × 480(25 KB) | UncleDouggie | Added grid lines to match original PNG file, changed color of classical plot to black as required by existing text in some articles that use the PNG version. | |
| 2010年6月5日 (六) 15:58 |  | 600 × 480(11 KB) | Darth Kule | fix mistake |
文件用途
全域文件用途
以下其他wiki使用此文件:
- af.wikipedia.org上的用途
- ar.wikipedia.org上的用途
- arz.wikipedia.org上的用途
- as.wikipedia.org上的用途
- beta.wikiversity.org上的用途
- bn.wikipedia.org上的用途
- bs.wikipedia.org上的用途
- ca.wikipedia.org上的用途
- ckb.wikipedia.org上的用途
- cs.wikipedia.org上的用途
- da.wikipedia.org上的用途
- en.wikipedia.org上的用途
- Black body
- Planck's law
- Ultraviolet catastrophe
- Astronomical spectroscopy
- Black-body radiation
- Modern physics
- Portal:Physics
- Introduction to quantum mechanics
- Talk:Extinction (astronomy)
- History of quantum mechanics
- Planck constant
- Wikipedia:Reference desk/Archives/Science/2011 November 12
- Wikipedia:Reference desk/Archives/Science/2023 July 20
- Wikipedia:Reference desk/Archives/Science/2023 October 3
- en.wikibooks.org上的用途
- en.wikiquote.org上的用途
- en.wikiversity.org上的用途
- User:Marshallsumter/Radiation astronomy/Cyans
- User:Marshallsumter/Radiation astronomy1/Mathematics
- Draft:Original research/Radiation physics
- Problems/Astronomy
- Planck's equation
- Talk:WikiJournal of Science/Submissions/Introduction to quantum mechanics
- Radiation/Electromagnetics
- User:Marshallsumter/Radiation astronomy/Electromagnetics
- Portal:Radiation astronomy/Problems
- Portal:Radiation astronomy/Problems/6
- User:Marshallsumter/Radiation astronomy/Blacks
- eo.wikipedia.org上的用途
查看本文件的更多全域用途。