File:Density of ice and water (en).svg

此SVG文件的PNG预览的大小:573 × 379像素。 其他分辨率:320 × 212像素 | 640 × 423像素 | 1,024 × 677像素 | 1,280 × 847像素 | 2,560 × 1,693像素。
原始文件 (SVG文件,尺寸为573 × 379像素,文件大小:323 KB)
摘要
| 描述 |
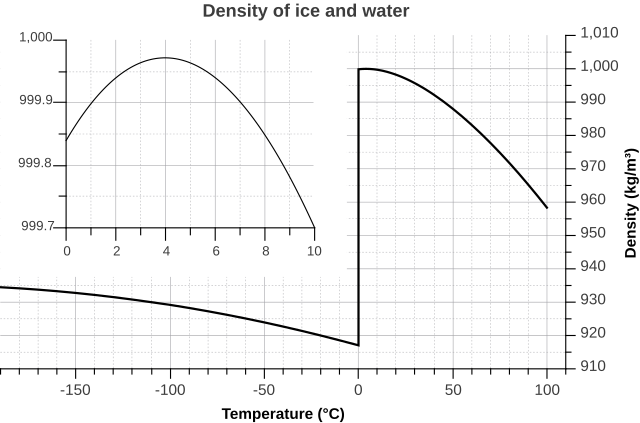
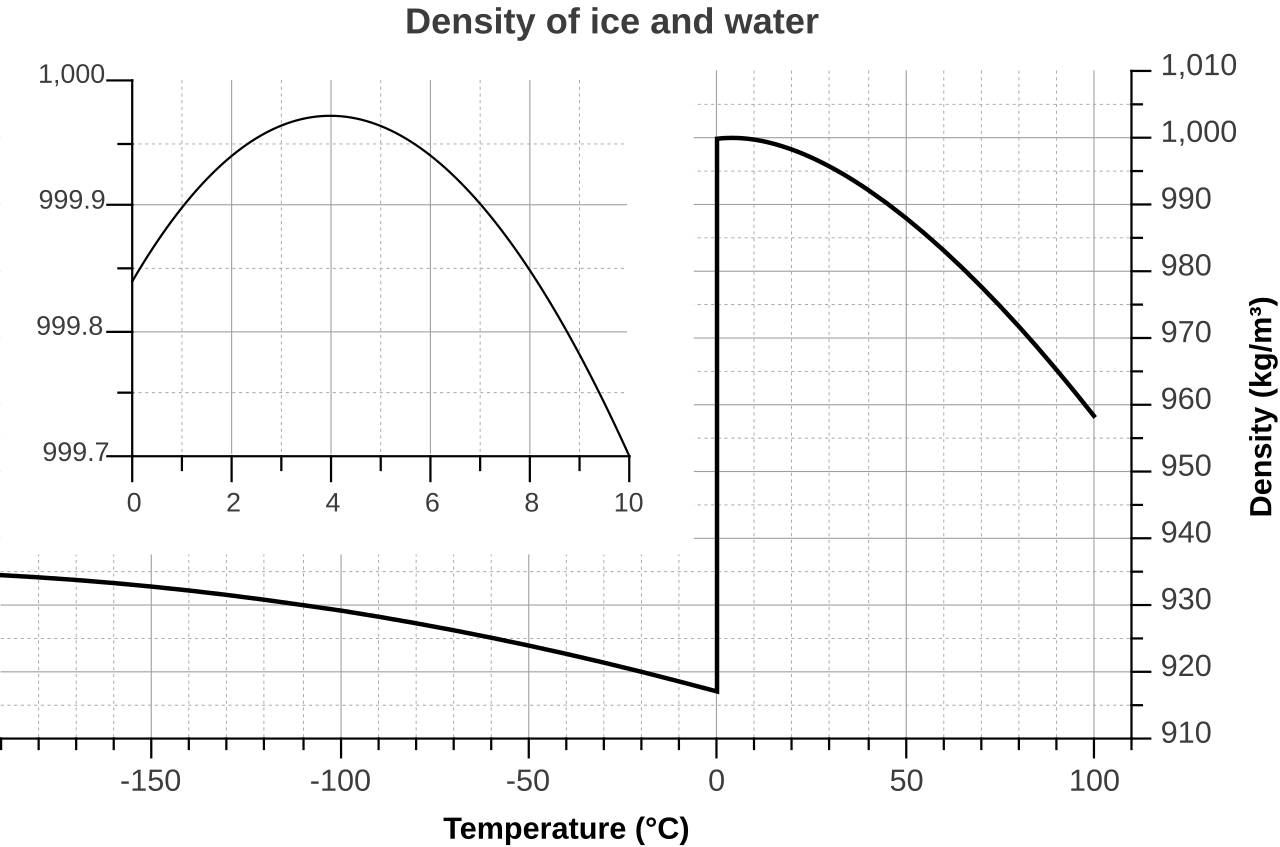
English: Density of ice and water as a function of temperature Deutsch: Dichte von Eis und Wasser in Abhängigkeit von der Temperatur |
| 日期 | |
| 来源 | 自己的作品 |
| 作者 | Klaus-Dieter Keller, created with QtiPlot, Font: Liberation Sans |
| 其他版本 |
|
.svg)
.svg)
.svg)

.svg?uselang=zh)
.svg?uselang=zh)
.svg?action=history&uselang=zh)
.svg)
许可协议
我,本作品著作权人,特此采用以下许可协议发表本作品:
本文件采用知识共享署名-相同方式共享 3.0 未本地化版本许可协议授权。
- 您可以自由地:
- 共享 – 复制、发行并传播本作品
- 修改 – 改编作品
- 惟须遵守下列条件:
- 署名 – 您必须对作品进行署名,提供授权条款的链接,并说明是否对原始内容进行了更改。您可以用任何合理的方式来署名,但不得以任何方式表明许可人认可您或您的使用。
- 相同方式共享 – 如果您再混合、转换或者基于本作品进行创作,您必须以与原先许可协议相同或相兼容的许可协议分发您贡献的作品。
Data
- Ice: Chapter 3.22d of http://www.ptb.de/cms/fileadmin/internet/publikationen/buecher/Kohlrausch/Tabellen/Kohlrausch_3_Tabellen_und_Diagramme_Waerme.pdf
-180;934
-150;933
-120;931
-100;929
-80;927
-60;925
-40;923
-20;920
0;917
0;999.840
1;999.899
2;999.940
3;999.964
4;999.972
5;999.964
6;999.940
7;999.902
8;999.848
9;999.781
10;999.700
11;999.6
12;999.5
13;999.38
14;999.24
15;999.1
16;998.94
17;998.77
18;998.59
19;998.4
20;998.2
21;997.99
22;997.77
23;997.54
24;997.29
25;997.04
26;996.78
27;996.51
28;996.23
29;995.94
30;995.64
31;995.34
32;995.02
33;994.7
34;994.37
35;994.03
36;993.68
37;993.32
38;992.96
39;992.59
40;992.21
45;990.21
50;988.03
55;985.69
60;983.19
65;980.55
70;977.76
75;974.84
80;971.79
85;968.61
90;965.3
95;961.88
100;958.35
文件历史
点击某个日期/时间查看对应时刻的文件。
| 日期/时间 | 缩略图 | 大小 | 用户 | 备注 | |
|---|---|---|---|---|---|
| 当前 | 2018年2月14日 (三) 01:32 | | 573 × 379(323 KB) | Geek3 | More precise data now from virial expansion |
| 2018年2月14日 (三) 00:49 |  | 573 × 379(323 KB) | Geek3 | The plot lines were jagged due to a strange interpolation of coarsly rounded data points. Now the data is quadratically interpolated, which yields a smooth plot curve while staying within the accuracy of the underlying data points. | |
| 2012年4月15日 (日) 15:07 |  | 573 × 379(329 KB) | Kdkeller | Problems solved with the linux fonts | |
| 2012年4月15日 (日) 14:47 |  | 573 × 379(120 KB) | Kdkeller | cropped the transparent border | |
| 2012年4月15日 (日) 13:58 |  | 590 × 390(120 KB) | Kdkeller |
文件用途
全域文件用途
以下其他wiki使用此文件:
- ca.wikipedia.org上的用途
- en.wikipedia.org上的用途
- en.wikibooks.org上的用途
- fa.wikipedia.org上的用途
- fr.wikipedia.org上的用途
- pt.wikipedia.org上的用途
- www.wikidata.org上的用途
.svg)