File:Diagram showing the Earth's energy budget, which includes the greenhouse effect (NASA).png
Diagram_showing_the_Earth's_energy_budget,_which_includes_the_greenhouse_effect_(NASA).png (720 × 480像素,文件大小:61 KB,MIME类型:image/png)
.png?uselang=zh)
.png?uselang=zh)
.png?action=history&uselang=zh)
.png)

|
此diagram图片可使用矢量图形重新创建为SVG文件。这具有很多好处;更多信息请参见共享资源:待清理媒体。如果存在此图片的SVG格式,请将其上传,然后将此模板替换为
{{vector version available|新图片名称}}。
建议您将SVG命名为“Diagram showing the Earth's energy budget, which includes the greenhouse effect (NASA).svg”,这样在使用Vector version available(或Vva)模板时就不需要填写新图片名称参数。 |
摘要
| 描述 |
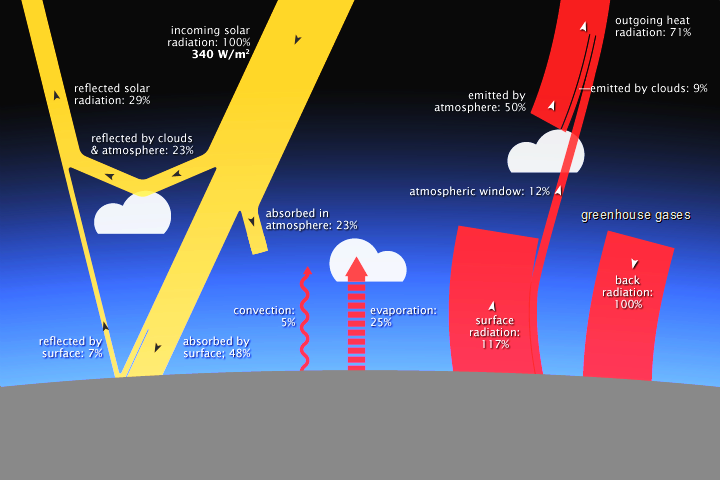
English: This diagram shows the Earth's energy budget, which includes the greenhouse effect. The following description is an edited quote from a public-domain source (Lindsey, 2009): On average, 340 watts per square meter (W.m-2) of solar energy arrives at the top of the atmosphere. Earth returns an equal amount of energy back to space by reflecting some incoming light and by radiating heat (thermal infrared energy). Most solar energy is absorbed at the surface, while most heat is radiated back to space by the atmosphere. Earth's average surface temperature is maintained by two large, opposing energy fluxes between the atmosphere and the ground (right)—the greenhouse effect. Incoming solar radiation to the Earth is equal to 340 watts per square meter (100%). Of this (units are a percentage of incoming solar radiation to the Earth):
The Earth's surface releases 5% of the energy into the atmosphere by convection and 25% by evaporation.
Trenberth et al. (2009) estimate an energy imbalance at the top-of-the-atmosphere of 0.9 watts per square meter, due to the enhanced greenhouse effect.
|
| 日期 | |
| 来源 | global_energy_budget_components.png, on: The Atmosphere’s Energy Budget (page 6), in Climate and Earth’s Energy Budget (author: Lindsey, R.), Feature Articles. Publisher: Earth Observatory, part of the EOS Project Science Office, located at NASA Goddard Space Flight Center |
| 作者 | Robert Simmon |
| 授权 (二次使用本文件) |
Image Use Policy: "Most materials published on the Earth Observatory, including images, are freely available for re-publication or re-use, including commercial purposes, with the following exceptions: *where copyright is indicated, you must obtain the copyright holder’s permission; we usually provide links to the organization that holds the copyright, *images from the SeaWiFS sensor older than five years are in the public domain and can be re-used or re-published for any purpose. Images less than five years old can be re-used only for educational or scientific purposes; any commercial use of such images must be coordinated with GeoEye. We ask that NASA’s Earth Observatory be given credit for its original materials; the only mandatory credit is NASA." Non-copyright status of image confirmed by e-mail. |
| 这是一张修改过的图片,这意味着它已在原版本的基础上通过软件进行了编辑,改动内容:(1) Adjusted colors to increase contrast and saturation, (2) modified text "greenhouse gases" to increase contrast。
|
许可协议
文件历史
点击某个日期/时间查看对应时刻的文件。
| 日期/时间 | 缩略图 | 大小 | 用户 | 备注 | |
|---|---|---|---|---|---|
| 当前 | 2016年2月29日 (一) 22:49 | | 720 × 480(61 KB) | Cmdrjameson | Compressed with pngout. Reduced by 30kB (33% decrease). |
| 2012年10月31日 (三) 06:21 |  | 720 × 480(91 KB) | Enescot | {{Information |Description ={{en|1=This diagram shows the Earth's energy budget, which includes the greenhouse effect. The following description is an edited quote from a public-domain source (... |
文件用途
以下页面使用本文件:
全域文件用途
以下其他wiki使用此文件:
- da.wikipedia.org上的用途
- en.wikipedia.org上的用途
- en.wikibooks.org上的用途
- ga.wikipedia.org上的用途
- it.wikipedia.org上的用途
- nn.wikipedia.org上的用途
- no.wikipedia.org上的用途
- sv.wikipedia.org上的用途
.png)