File:GW170814 signal.png
本预览的尺寸:800 × 494像素。 其他分辨率:320 × 198像素 | 640 × 395像素 | 1,024 × 633像素 | 1,280 × 791像素 | 2,560 × 1,582像素 | 4,159 × 2,570像素。
原始文件 (4,159 × 2,570像素,文件大小:2.54 MB,MIME类型:image/png)
摘要
| 描述 |
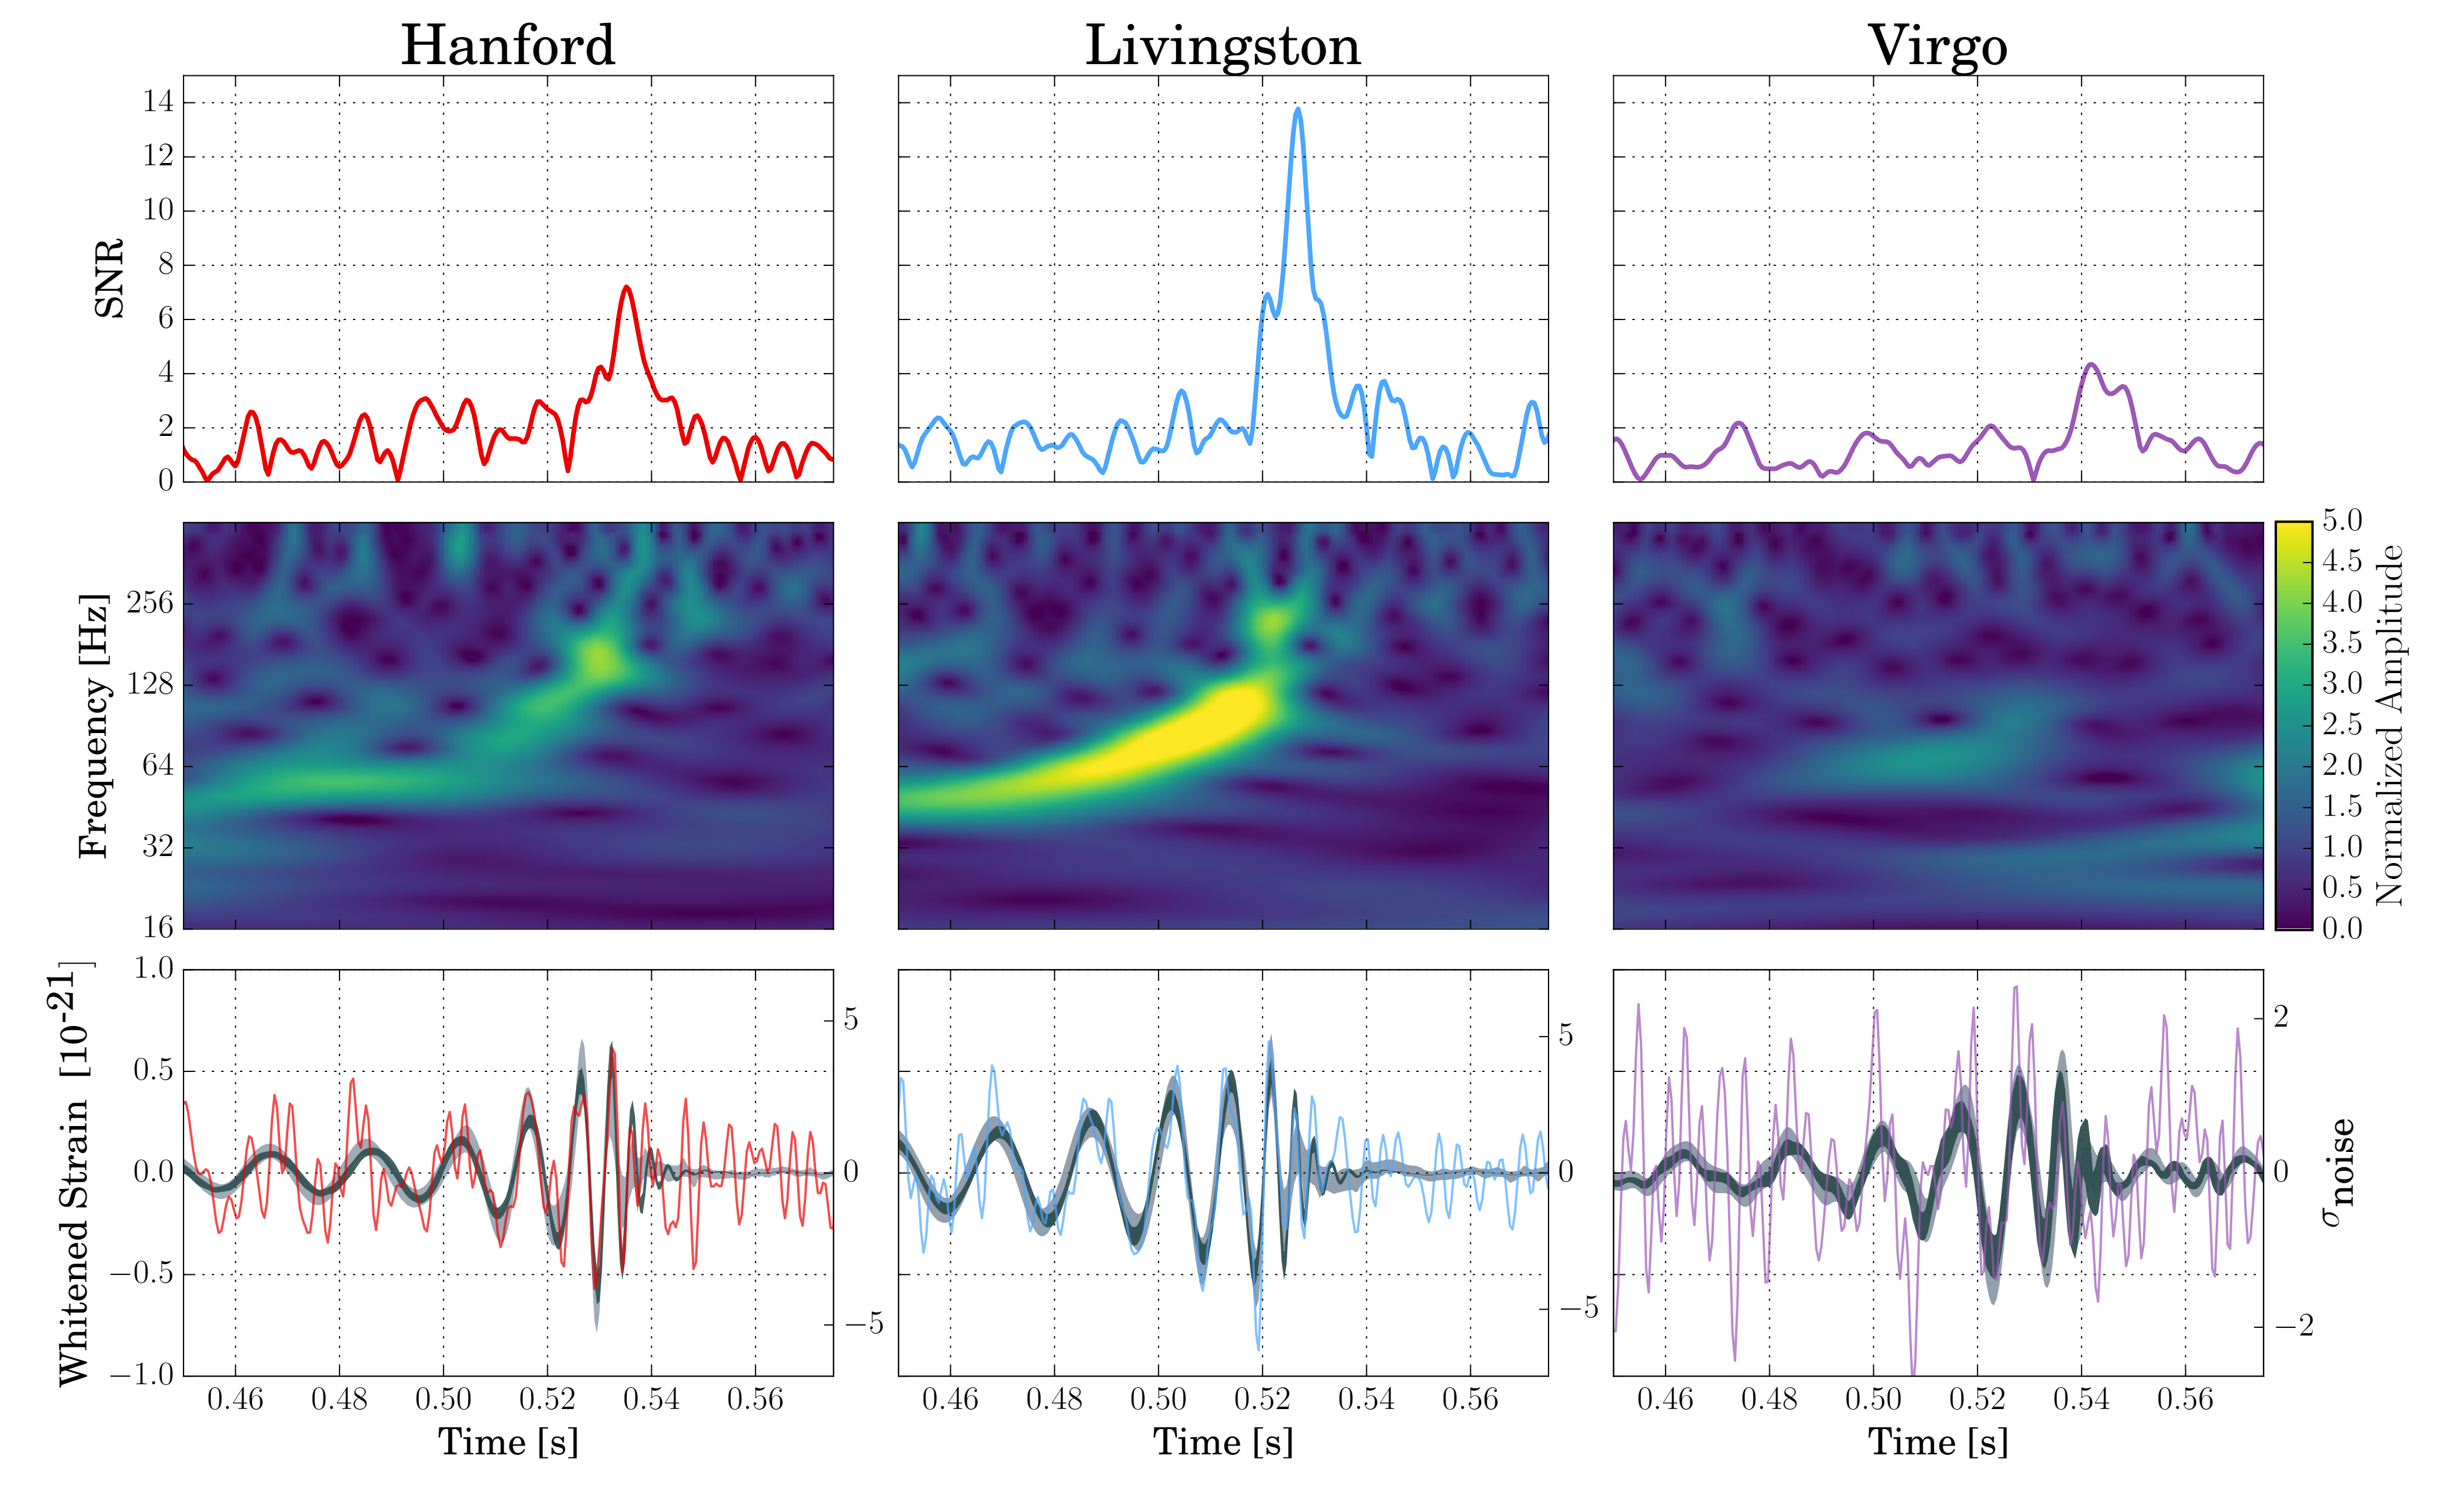
English: Top row: Signal-to-noise ratio as a function of time. The peaks occur at different times in different detectors because gravitational waves propagate at the finite speed of light; this causes the signal to reach the detectors at different times. GW170814 arrived first in LIGO-Livingston, then 8 ms later in LIGO-Hanford and 6 ms after that in Virgo.
Middle row: Time-frequency representation of the strain data. The brighter a given pixel in any of the three 2D-maps, the larger the signal at this particular time and frequency with respect to the expected noise level. Note the characteristic "chirp" pattern of increasing frequency with time. Bottom row: Strain time series with the best waveforms selected by the matched filtering (black solid curves) and unmodeled search methods (gray bands) superimposed. |
| 日期 | |
| 来源 |
http://ligo.org/science/Publication-GW170814/index.php 本PNG 位图使用Matplotlib创作. |
| 作者 | LIGO Scientific Collaboration and Virgo Collaboration |
许可协议
本文件采用知识共享署名-相同方式共享 4.0 国际许可协议授权。
- 您可以自由地:
- 共享 – 复制、发行并传播本作品
- 修改 – 改编作品
- 惟须遵守下列条件:
- 署名 – 您必须对作品进行署名,提供授权条款的链接,并说明是否对原始内容进行了更改。您可以用任何合理的方式来署名,但不得以任何方式表明许可人认可您或您的使用。
- 相同方式共享 – 如果您再混合、转换或者基于本作品进行创作,您必须以与原先许可协议相同或相兼容的许可协议分发您贡献的作品。
文件历史
点击某个日期/时间查看对应时刻的文件。
| 日期/时间 | 缩略图 | 大小 | 用户 | 备注 | |
|---|---|---|---|---|---|
| 当前 | 2017年9月28日 (四) 06:29 | | 4,159 × 2,570(2.54 MB) | Earthandmoon | User created page with UploadWizard |
文件用途
以下页面使用本文件:
全域文件用途
以下其他wiki使用此文件:
- ca.wikipedia.org上的用途
- en.wikipedia.org上的用途
- es.wikipedia.org上的用途
- fr.wikipedia.org上的用途
- it.wikipedia.org上的用途
- ja.wikipedia.org上的用途
- ko.wikipedia.org上的用途
- pl.wikipedia.org上的用途
- ru.wikipedia.org上的用途
- vi.wikipedia.org上的用途
- www.wikidata.org上的用途