File:Level set method.jpg
此为最大尺寸。
Level_set_method.jpg (800 × 600像素,文件大小:89 KB,MIME类型:image/jpeg)
摘要
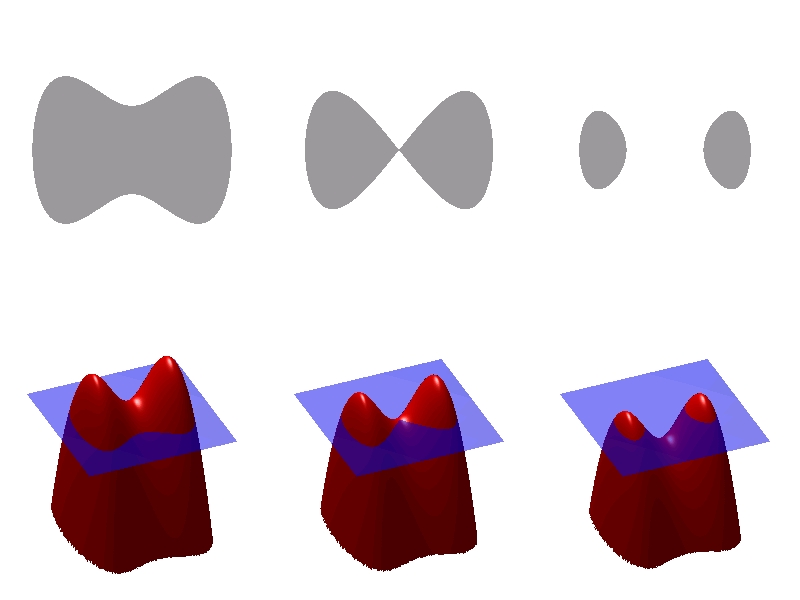
| 描述 | Illustration of en:Level set method. |
| 日期 | 2004年11月25日 (原始上传日期) |
| 来源 | 本檔案是從en.wikipedia轉移到維基共享資源。 |
| 作者 | 英语维基百科的Olegalexandrov |
许可协议
| 本作品已被作者英语维基百科的Olegalexandrov释出到公有领域。这适用于全世界。 在一些国家这可能不合法;如果是这样的话,那么: Olegalexandrov无条件地授予任何人以任何目的使用本作品的权利,除非这些条件是法律规定所必需的。 |
MATLAB source code (public domain)
function level_set_method()
   figure(1); clf; % pop up a figure, and clean it up
for i=1:3 % make a loop to draw the six pictures in pairs
   level_disp(i);
end

print('-djpeg100',  '-r100', 'level_set_method.jpg') % save to file.

function level_disp(p)

   Lx=2.5; Ly=2.5; % box is [-Lx Lx] x [-Ly, Ly]
   N=60;  % number of points (don't make it big, code will be slow)
   heights=[0.7+eps, 0.00001, -0.7+eps]; % cut the surface at these heights
   height=heights(p); % current cut

   [X, Y]=meshgrid(-Lx:(1/N):Lx, -Ly:(1/N):Ly);     % X and Y coordinates
   Z=height-0.5*(X-1.78).*X.^2.*(X+1.78)-Y.^2;  % Z=f(X, Y) -surface

   lowest=-4;
   [m, n]=size(Z);
   for i=1:m
      for j=1:n
 if Z(i, j)< lowest; % truncate the surface somewhere
    Z(i, j)=NaN;
 end
      end
   end

% draw the surface and the plane cut
   figure(1); subplot('Position', [(p-1)/3, 0., 0.33, 0.5]); hold on;
   surf(X, Y, Z, 'FaceColor','red', 'EdgeColor','none', 'FaceAlpha', 1);
   surf(X, Y, zeros(m, n), 'FaceColor','blue', 'EdgeColor','none', 'FaceAlpha', 0.3);
   camlight left;lighting phong; % make nice lightning
   axis([-Lx Lx -Ly Ly lowest 1.8]); axis equal;  axis off; %the coordinate box
   view(-23, 34)        % angle of view (polar coordinates)

% draw the shape (cross-section)
   figure(1); subplot('Position', [(p-1)/3, 0.5, 0.33, 0.5]); % subwindow
   [c, stuff] = contour(X, Y, Z, [0, 0]); % draw the contours.
   l=c(2, 1);
   x=c(1,2:(l+1));  y=c(2,2:(l+1)); % get x and y of contours
   H=fill(x, y, 0.6*[1, 1, 1]); set(H, 'EdgeColor', 'none'); % draw the shape

   [u, v]=size(c);
   if v > l+2 % special case: two connected components
      x=c(1,(l+3):(2*l)); y=c(2,(l+3):(2*l)); % contours
      hold on; % hold the graph for the second component
      H=fill(x, y, 0.6*[1, 1, 1]); set(H, 'EdgeColor', 'none');
   end
   axis equal; axis off; axis([-Lx Lx -Ly Ly]); % frame size
原始上传日志
原始描述頁面位於這裡。下列使用者名稱均來自en.wikipedia。
- 2004-11-25 03:20 Olegalexandrov 800×600×8 (90808 bytes) Illustration of level set method. {{PD}}

|
此math图片可使用矢量图形重新创建为SVG文件。这具有很多好处;更多信息请参见共享资源:待清理媒体。如果存在此图片的SVG格式,请将其上传,然后将此模板替换为
{{vector version available|新图片名称}}。
建议您将SVG命名为“Level set method.svg”,这样在使用Vector version available(或Vva)模板时就不需要填写新图片名称参数。 |


文件历史
点击某个日期/时间查看对应时刻的文件。
| 日期/时间 | 缩略图 | 大小 | 用户 | 备注 | |
|---|---|---|---|---|---|
| 当前 | 2007年6月2日 (六) 03:19 | | 800 × 600(89 KB) | Oleg Alexandrov | {{Information |Description= Illustration of en:Level set method. |Source=Originally from [http://en.wikipedia.org en.wikipedia]; description page is/was [http://en.wikipedia.org/w/index.php?title=Image%3ALevel_set_method.jpg here]. |Date=2004-11-25 ( |
文件用途
以下页面使用本文件:
全域文件用途
以下其他wiki使用此文件:
- en.wikipedia.org上的用途
- es.wikipedia.org上的用途
- fr.wikipedia.org上的用途
- pl.wikipedia.org上的用途