File:MaxwellBoltzmann-en.svg

此SVG文件的PNG预览的大小:540 × 360像素。 其他分辨率:320 × 213像素 | 640 × 427像素 | 1,024 × 683像素 | 1,280 × 853像素 | 2,560 × 1,707像素。
原始文件 (SVG文件,尺寸为540 × 360像素,文件大小:60 KB)
W3C-validity not checked.
摘要
| 描述 |
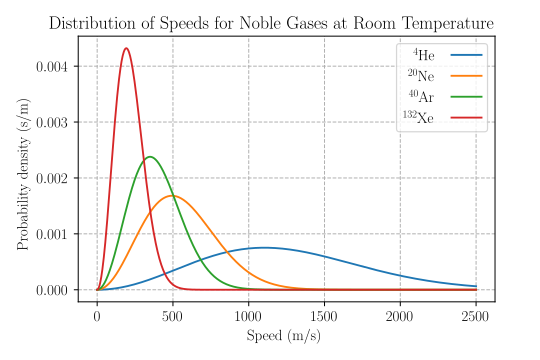
Plot of Maxwell Boltzmann distribution of speeds of noble gasses. The plot is of f(v) dv and since I added units along the x-axis of m/s (that is distance per time), the pdf had units s/m. I made this image, and am placing it in the public domain. Pdbailey 17:51, 24 Oct 2004 (UTC)
Formaten:Category:Probability distributions images |
| 日期 | 2004年10月24日 (原始上传日期) |
| 来源 | Originally from en.wikipedia; description page is/was here. |
| 作者 |
Later versions were uploaded by Cryptic C62 at en.wikipedia. Convert into SVG by Lilyu from Image:MaxwellBoltzmann.gif. |
| 其他版本 |
|


| 本作品已被作者英语维基百科的Pdbailey释出到公有领域。这适用于全世界。 在一些国家这可能不合法;如果是这样的话,那么: Pdbailey无条件地授予任何人以任何目的使用本作品的权利,除非这些条件是法律规定所必需的。 |
文件历史
点击某个日期/时间查看对应时刻的文件。
| 日期/时间 | 缩略图 | 大小 | 用户 | 备注 | |
|---|---|---|---|---|---|
| 当前 | 2020年12月8日 (二) 19:30 | | 540 × 360(60 KB) | AkanoToE | Updated formatting, tweaked title text, moved legend |
| 2009年11月18日 (三) 04:54 |  | 700 × 463(29 KB) | Lilyu | arial => Deja vu sans condensed bold to resolve compatibility pb with mediawiki | |
| 2009年2月10日 (二) 22:28 |  | 700 × 463(25 KB) | Incredio | add numerical labels to tick marks on y axis | |
| 2008年3月5日 (三) 22:51 |  | 667 × 463(22 KB) | Lilyu | ||
| 2008年3月5日 (三) 04:38 |  | 667 × 463(20 KB) | Lilyu | {{Information |Description=Plot of Maxwell Boltzmann distribution of speeds of noble gasses. The plot is of f(v) dv and since I added units along the x-axis of m/s (that is distance per time), the pdf had units s/m. I made this image, and am placing it in |
文件用途
以下3个页面使用本文件:
全域文件用途
以下其他wiki使用此文件:
- ar.wikipedia.org上的用途
- cs.wikipedia.org上的用途
- da.wikipedia.org上的用途
- de.wikibooks.org上的用途
- en.wikipedia.org上的用途
- fr.wikipedia.org上的用途
- hr.wikipedia.org上的用途
- hu.wikipedia.org上的用途
- id.wikipedia.org上的用途
- lv.wikipedia.org上的用途
- nn.wikipedia.org上的用途
- no.wikipedia.org上的用途
- sr.wikipedia.org上的用途
- th.wikipedia.org上的用途
- uz.wikipedia.org上的用途