File:Min ozone.jpg
本预览的尺寸:777 × 599像素。 其他分辨率:311 × 240像素 | 622 × 480像素 | 792 × 611像素。
原始文件 (792 × 611像素,文件大小:141 KB,MIME类型:image/jpeg)
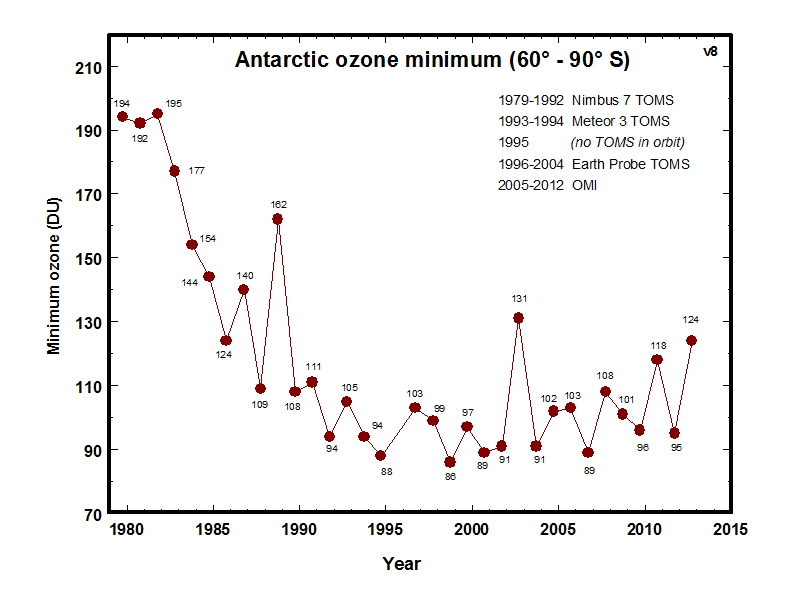
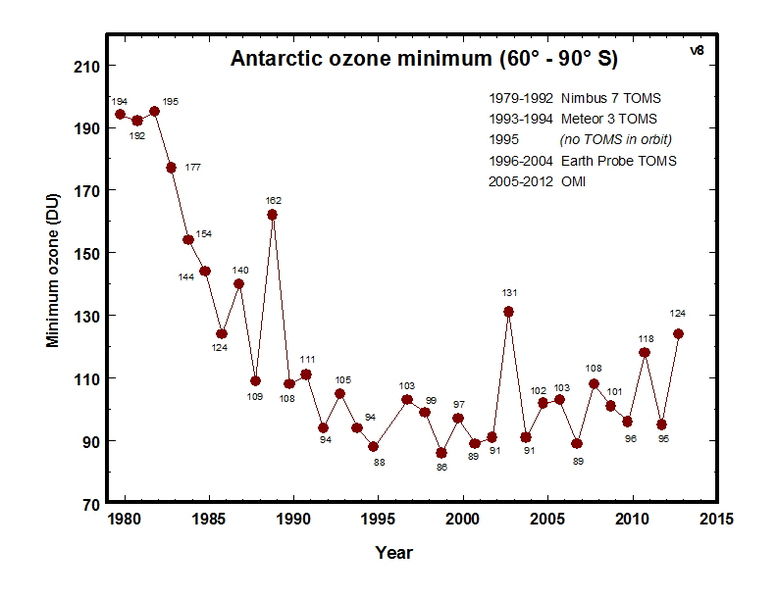
This image shows the lowest value of ozone measured by TOMS each year in the ozone hole.
Global average ozone is about 300 Dobson units. Before 1980 ozone less than 200 Dobson units was rarely seen. In recent years ozone near 100 Dobson units has become normal in the ozone hole. Ozone in the year 2002 ozone hole was higher than we have come to expect because of unusually high temperatures in the Antarctic stratosphere.

|
此graph图片可使用矢量图形重新创建为SVG文件。这具有很多好处;更多信息请参见共享资源:待清理媒体。如果存在此图片的SVG格式,请将其上传,然后将此模板替换为
{{vector version available|新图片名称}}。
建议您将SVG命名为“Min ozone.svg”,这样在使用Vector version available(或Vva)模板时就不需要填写新图片名称参数。 |


|
This image shows some kind of simple graph/chart that could be converted to a Wikichart. Storing graphs or charts as images makes it harder to change (correct or translate) them. Wikicharts also help making sure to be consistent in font and size. |
|
| |
| 本文件完全由NASA创作,在美国属于公有领域。根据NASA的版权方针,NASA的材料除非另有声明否则不受版权保护。(参见Template:PD-USGov/zh、NASA版权方针页面或JPL图片使用方针。) | ||
 |
警告:
|
文件历史
点击某个日期/时间查看对应时刻的文件。
| 日期/时间 | 缩略图 | 大小 | 用户 | 备注 | |
|---|---|---|---|---|---|
| 当前 | 2012年10月25日 (四) 20:50 | | 792 × 611(141 KB) | Celuca | Update from http://jwocky.gsfc.nasa.gov/eptoms/dataqual/oz_hole_annual_min_v8.jpg |
| 2009年5月28日 (四) 00:06 |  | 792 × 611(95 KB) | Atmoz | update graph from http://macuv.gsfc.nasa.gov/images/Ozhole_Minimum_graph.JPG | |
| 2006年5月9日 (二) 04:45 |  | 792 × 611(99 KB) | Muu-karhu | {{PD-USGov-NASA}} |
文件用途
以下页面使用本文件:
全域文件用途
以下其他wiki使用此文件:
- bg.wikipedia.org上的用途
- ca.wikipedia.org上的用途
- cs.wikipedia.org上的用途
- en.wikipedia.org上的用途
- es.wikipedia.org上的用途
- fi.wikipedia.org上的用途
- fr.wikipedia.org上的用途
- gl.wikipedia.org上的用途
- gu.wikipedia.org上的用途
- hi.wikipedia.org上的用途
- hr.wikipedia.org上的用途
- id.wikipedia.org上的用途
- it.wikipedia.org上的用途
- kn.wikipedia.org上的用途
- nl.wikipedia.org上的用途
- pl.wikipedia.org上的用途
- pt.wikipedia.org上的用途
- sh.wikipedia.org上的用途
- ta.wikipedia.org上的用途
- test.wikipedia.org上的用途
- te.wikipedia.org上的用途
- vi.wikipedia.org上的用途