File:PbSO4 solubility graph.png

本预览的尺寸:800 × 489像素。 其他分辨率:320 × 196像素 | 640 × 391像素 | 1,024 × 626像素 | 1,436 × 878像素。
原始文件 (1,436 × 878像素,文件大小:12 KB,MIME类型:image/png)

|
此graph图片可使用矢量图形重新创建为SVG文件。这具有很多好处;更多信息请参见共享资源:待清理媒体。如果存在此图片的SVG格式,请将其上传,然后将此模板替换为
{{vector version available|新图片名称}}。
建议您将SVG命名为“PbSO4 solubility graph.svg”,这样在使用Vector version available(或Vva)模板时就不需要填写新图片名称参数。 |
摘要
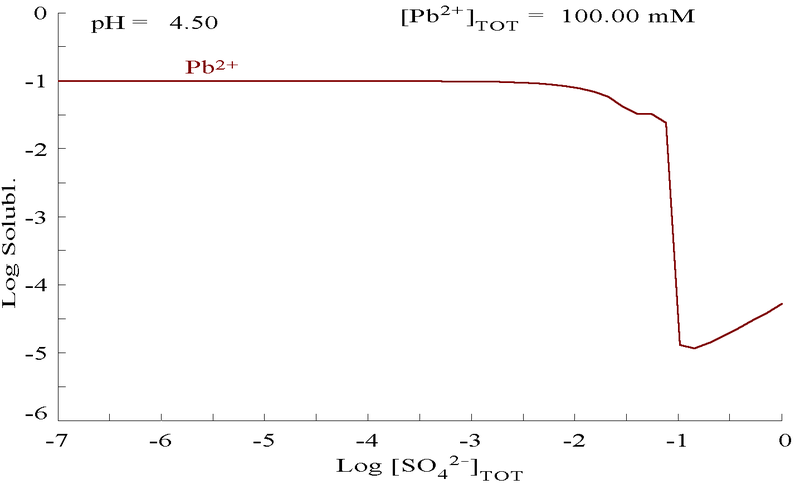
| 描述 | Plot showing aqueous concentration of dissolved Pb2+ (max available concentration = 0.1M) as a function of SO42− at pH=4.5, which is the max pH at which 0.1M Pb2+ can exist. |
| 日期 | |
| 来源 | self-made using Hydra/Medusa software, freely downloadable from [1]. Edited using Gimp 2.2 |
| 作者 | Karlhahn |
许可协议
| 我,本作品著作权人,释出本作品至公有领域。这适用于全世界。 在一些国家这可能不合法;如果是这样的话,那么: 我无条件地授予任何人以任何目的使用本作品的权利,除非这些条件是法律规定所必需的。 |
文件历史
点击某个日期/时间查看对应时刻的文件。
| 日期/时间 | 缩略图 | 大小 | 用户 | 备注 | |
|---|---|---|---|---|---|
| 当前 | 2010年7月2日 (五) 11:48 | | 1,436 × 878(12 KB) | Materialscientist | crop whitespace |
| 2007年9月28日 (五) 03:20 |  | 1,680 × 1,050(14 KB) | Karlhahn | New version thickens plot trace. {{Information |Description=Plot showing aqueous concentration of dissolved Pb<sup>2+</sub> (max available concentration = 0.1M) as a function of SO<sub>4</sub><sup>2−</sup> at pH=4.5, which is the max pH at which 0.1M P | |
| 2007年9月28日 (五) 02:49 |  | 1,680 × 1,050(14 KB) | Karlhahn | {{Information |Description=Plot showing aqueous concentration of dissoved Pb<sup>2+</sub> (max available concentration = 0.1M) as a function of SO<sub>4</sub><sup>2−</sup> at pH=4.5, which is the max concentration at which 0.1M Pb<sup>2+</sup> can exist |
文件用途
以下页面使用本文件:
全域文件用途
以下其他wiki使用此文件:
- cs.wikipedia.org上的用途
- en.wikipedia.org上的用途
- vi.wikipedia.org上的用途