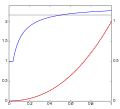
File:SRGB gamma.svg

此SVG文件的PNG预览的大小:512 × 464像素。 其他分辨率:265 × 240像素 | 530 × 480像素 | 847 × 768像素 | 1,130 × 1,024像素 | 2,260 × 2,048像素。
原始文件 (SVG文件,尺寸为512 × 464像素,文件大小:1 KB)
文件历史
点击某个日期/时间查看对应时刻的文件。
| 日期/时间 | 缩略图 | 大小 | 用户 | 备注 | |
|---|---|---|---|---|---|
| 当前 | 2020年6月2日 (二) 16:05 |  | 512 × 464(1 KB) | Jarvisa | Simplified SVG source |
| 2008年4月23日 (三) 21:40 |  | 512 × 463(62 KB) | Morningfrost | {{Information |Description=I made this in matlab to show the sRGB gamma expansion curve (red), the gamma 2.2 power law (black, behind the red mostly), and the local gamma of the sRGB curve (blue). |Source=English Wikipedia |Date= |Author=user Dicklyon, en |
文件用途
以下页面使用本文件:
全域文件用途
以下其他wiki使用此文件:
- en.wikipedia.org上的用途
- fr.wikibooks.org上的用途
- it.wikipedia.org上的用途
- ja.wikipedia.org上的用途
- pl.wikipedia.org上的用途
