File:Thiel-Sen estimator.svg

此SVG文件的PNG预览的大小:572 × 599像素。 其他分辨率:229 × 240像素 | 458 × 480像素 | 733 × 768像素 | 978 × 1,024像素 | 1,955 × 2,048像素 | 2,936 × 3,075像素。
原始文件 (SVG文件,尺寸为2,936 × 3,075像素,文件大小:37 KB)
摘要
| 描述 |
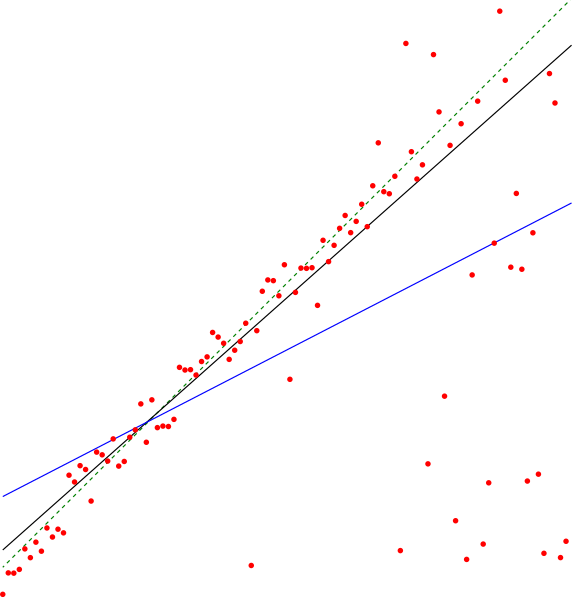
English: The en:Theil–Sen estimator (black line) of a set of sample points, compared to the simple linear regression line (blue). The points were generated by adding a small amount of jitter to points on the green dashed line and then replacing some of the points by random outliers. |
| 日期 | |
| 来源 | 自己的作品 |
| 作者 | David Eppstein |
许可协议
我,本作品著作权人,特此采用以下许可协议发表本作品:
| 本作品采用知识共享CC0 1.0 通用公有领域贡献许可协议授权。 | |
| 采用本宣告发表本作品的人,已在法律允许的范围内,通过在全世界放弃其对本作品拥有的著作权法规定的所有权利(包括所有相关权利),将本作品贡献至公有领域。您可以复制、修改、传播和表演本作品,将其用于商业目的,无需要求授权。
|
Source code
This image was created as a pdf file by the following Python code, then converted to SVG.
from pyx import canvas,path,color
from random import random,seed
seed(12345)

N = 103
noise = 10
slope = 1.0

def sample(x):
    y = x * slope
    if random() < (y/N)**3:
        y = random()*N      # outlier
    else:
        y += (random()-0.5)*noise # non-outlier, jitter
    return y

samples = [(i*1.0,sample(i)) for i in range(N)]

c = canvas.canvas()

for x,y in samples:
    c.fill(path.circle(x,y,0.5),[color.rgb.red])

def theilsen(samples):
    N = len(samples)
    def slope(i,j):
        xi,yi = samples[i]
        xj,yj = samples[j]
        return (yi-yj)/(xi-xj)

    def median(L):
        L.sort()
        if len(L) & 1:
            return L[len(L)//2]
        else:
            return (L[len(L)//2 - 1] + L[len(L)//2])/2.0

    m = median([slope(i,j) for i in range(N) for j in range(i)])

    def error(i):
        x,y = samples[i]
        return y - m*x

    b = median([error(i) for i in range(N)])

    return m,b

m,b = 1,0
c.stroke(path.line(0,b,N,N*m+b),[color.rgb.green])

m,b = theilsen(samples)
c.stroke(path.line(0,b,N,N*m+b),[color.rgb.black])

def slr(samples):
    N = len(samples)
    sumxy = sum([x*y for x,y in samples])
    sumx = sum([x for x,y in samples])
    sumy = sum([y for x,y in samples])
    sumxx = sum([x*x for x,y in samples])
    m = (sumxy - sumx*sumy/N)/(sumxx - sumx**2/N)
    b = sumy/N - m*sumx/N
    return m,b

m,b = slr(samples)
c.stroke(path.line(0,b,N,N*m+b),[color.rgb.blue])

c.writePDFfile("ThielSen")
文件历史
点击某个日期/时间查看对应时刻的文件。
| 日期/时间 | 缩略图 | 大小 | 用户 | 备注 | |
|---|---|---|---|---|---|
| 当前 | 2011年11月3日 (四) 18:59 | | 2,936 × 3,075(37 KB) | David Eppstein | Darker green, thicker lines |
| 2011年7月3日 (日) 23:40 |  | 2,936 × 3,075(37 KB) | David Eppstein | {{Information |Description ={{en|1=The en:Theil–Sen estimator (black line) of a set of sample points, compared to the simple linear regression line (blue). The points were generated by adding a small amount of jitter to points on the green dashe |
文件用途
以下页面使用本文件:
全域文件用途
以下其他wiki使用此文件:
- ar.wikipedia.org上的用途
- el.wiktionary.org上的用途
- en.wikipedia.org上的用途
- es.wikipedia.org上的用途
- fa.wikipedia.org上的用途
- hy.wikipedia.org上的用途
- ko.wikipedia.org上的用途
- ru.wikipedia.org上的用途