File:Global Temperature Anomaly.svg

此SVG文件的PNG预览的大小:800 × 556像素。 其他分辨率:320 × 222像素 | 640 × 444像素 | 1,024 × 711像素 | 1,280 × 889像素 | 2,560 × 1,778像素 | 1,440 × 1,000像素。
原始文件 (SVG文件,尺寸为1,440 × 1,000像素,文件大小:28 KB)
摘要
| 描述Global Temperature Anomaly.svg |
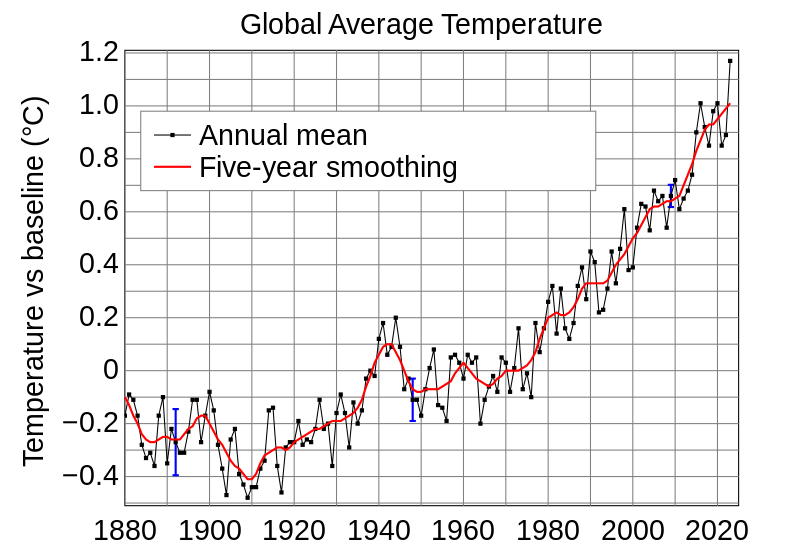
English: Land-ocean temperature index, 1880 to present, with base period 1951-1980. The solid black line is the global annual mean and the solid red line is the five-year lowess smooth. The blue uncertainty bars represents the total (LSAT and SST) annual uncertainty at a 95% confidence interval. [More information on the updated uncertainty model can be found here: Lenssen et al. (2019).]
The following translations are not updated: Čeština: Čárový graf globálního průměrného teplotního indexu Země-oceán, od roku 1880 do současnosti, k základnímu období 1951-1980. Černá čára je roční průměr a červená čára je pětiletý klouzavý průměr. [Toto je aktualizace Obr. 1A v Hansen et al. (2006).] Graf ukazuje celkový dlouhodobý trend oteplování dlouhodobý trend oteplování.
Español: Índice de la temperatura media global, desde 1880 hasta la actualidad, con el período base 1951-1980. La línea negra sólida es la media global anual y la línea roja sólida es una curva suavizada con una regresión local no paramétrica basada en un modelo k vecino más cercano. La función se evalúa utilizando una parte de los datos correspondiente a un rango de diez años de datos, lo que resulta en un suavizado en la práctica de aproximadamente cinco años. Las barras azules representan la incertidumbre (límite de confianza del 95%) para el caso de observaciones espaciales incompletas. Esto se basa en la Fig. 1A en Hansen et al. (2006) y la Fig. 9a en Hansen et al. (2010). Gráfico actualizado con datos hasta 2016 procedentes de https://data.giss.nasa.gov/gistemp/graphs/. El gráfico muestra una tendencia global de calentamiento a largo plazo. |
||
| 日期 | |||
| 来源 | https://data.giss.nasa.gov/gistemp/graphs_v4/ | ||
| 作者 | NASA Goddard Institute for Space Studies, changed | ||
| 其他版本 |
此文件衍生的作品: Globalni teplotni odchylka cs.svg (czech) 此文件衍生的作品: Temperature Anomaly 1880-now NL.svg (dutch) |
||
| SVG开发 InfoField | 本矢量图使用未知SVG工具创作。 此SVG 文件通过SVG <switch>元素进行翻译:所有译文都保存在同一文件中。
| ||
| 源代码 InfoField | SVG code
|
许可协议
| Public domainPublic domainfalsefalse |
| 本文件完全由NASA创作,在美国属于公有领域。根据NASA的版权方针,NASA的材料除非另有声明否则不受版权保护。(参见Template:PD-USGov/zh、NASA版权方针页面或JPL图片使用方针。) |  | |
 |
警告:
|
说明
添加一行文字以描述该文件所表现的内容
Temperaturindex, 1880 bis heute, mit Basisperiode 1951-1980.
Indice di temperatura, dal 1880 ad oggi, con periodo base 1951-1980.
Índice de temperatura, desde 1880 hasta la actualidad, con periodo de base 1951-1980.
Temperaturindeks, 1880 til i dag, med basisperioden 1951-1980.
Índice de temperatura, de 1880 aos dias de hoje.
Teplotního index Země-oceán od roku 1880 do současnosti, k základnímu období 1951-1980
此文件中描述的项目
描绘内容
19 1 2018
image/svg+xml
文件历史
点击某个日期/时间查看对应时刻的文件。
| 日期/时间 | 缩略图 | 大小 | 用户 | 备注 | |
|---|---|---|---|---|---|
| 当前 | 2024年1月28日 (日) 23:51 |  | 1,440 × 1,000(28 KB) | Habitator terrae | updated // Editing SVG source code using c:User:Rillke/SVGedit.js |
| 2022年9月30日 (五) 06:05 |  | 1,440 × 1,000(28 KB) | আজিজ | File uploaded using svgtranslate tool (https://svgtranslate.toolforge.org/). Added translation for bn. | |
| 2022年1月19日 (三) 12:55 |  | 1,440 × 1,000(25 KB) | Habitator terrae | Update // Editing SVG source code using c:User:Rillke/SVGedit.js | |
| 2021年12月16日 (四) 13:43 |  | 1,400 × 1,000(25 KB) | Turbojet | File uploaded using svgtranslate tool (https://svgtranslate.toolforge.org/). Added translation for ro. | |
| 2021年6月4日 (五) 13:14 |  | 1,400 × 1,000(20 KB) | Sarang | text coding straightened | |
| 2021年1月14日 (四) 18:51 |  | 1,400 × 1,000(39 KB) | Habitator terrae | correct error in error_bar // Editing SVG source code using c:User:Rillke/SVGedit.js | |
| 2021年1月14日 (四) 18:48 |  | 1,400 × 1,000(39 KB) | Habitator terrae | correct errors // Editing SVG source code using c:User:Rillke/SVGedit.js | |
| 2021年1月14日 (四) 18:29 |  | 1,400 × 1,000(39 KB) | Habitator terrae | update according to https://data.giss.nasa.gov/gistemp/graphs_v4/graph_data/Global_Mean_Estimates_based_on_Land_and_Ocean_Data/graph.txt // Editing SVG source code using c:User:Rillke/SVGedit.js | |
| 2020年12月11日 (五) 19:57 |  | 1,400 × 1,000(39 KB) | EnaldoSS | File uploaded using svgtranslate tool (https://svgtranslate.toolforge.org/). Added translation for pt. | |
| 2020年7月14日 (二) 16:44 |  | 1,400 × 1,000(39 KB) | Habitator terrae | Korrektur // Editing SVG source code using c:User:Rillke/SVGedit.js |
文件用途
以下4个页面使用本文件:
全域文件用途
以下其他wiki使用此文件:
- als.wikipedia.org上的用途
- an.wikipedia.org上的用途
- ar.wikipedia.org上的用途
- arz.wikipedia.org上的用途
- as.wikipedia.org上的用途
- be-tarask.wikipedia.org上的用途
- be.wikipedia.org上的用途
- bg.wikipedia.org上的用途
- bh.wikipedia.org上的用途
- bn.wikipedia.org上的用途
- bxr.wikipedia.org上的用途
- ca.wikipedia.org上的用途
- ckb.wikipedia.org上的用途
- cs.wikipedia.org上的用途
- cv.wikipedia.org上的用途
- cy.wikipedia.org上的用途
- da.wikipedia.org上的用途
- de.wikipedia.org上的用途
- Klima
- Kontroverse um die globale Erwärmung
- Klimageschichte
- Energiewende
- Diskussion:Klimawandel/Archiv/1
- Zwei-Grad-Ziel
- Diskussion:Klimaschutz/Archiv
- Divestment (fossile Energien)
- Wikipedia:Grafikwerkstatt/Archiv/2017/Dezember
- Wikipedia:Auskunft/Archiv/2018/Woche 41
- Wikipedia:Hauptseite/Archiv/27. November 2018
- G20-Gipfel in Buenos Aires 2018
- Wikipedia Diskussion:Hauptseite/Artikel des Tages/Archiv/Vorschläge/2019/Q1
- Wikipedia Diskussion:Hauptseite/Artikel des Tages/Archiv/Vorschläge/2019/Q2
- Wikipedia:Hauptseite/Archiv/22. April 2019
- Diskussion:Globale Erwärmung/Archiv/014
- Benutzer:Hungchaka/Klimabewegung
- Zivilisationskollaps
- de.wiktionary.org上的用途
- diq.wikipedia.org上的用途
- el.wikipedia.org上的用途
- en.wikipedia.org上的用途
查看此文件的更多全域用途。
元数据
此文件含有额外信息,这些信息可能是创建或数字化该文件时使用的数码相机或扫描仪所添加的。如果文件已从其原始状态修改,某些详细信息可能无法完全反映修改后的文件。
| 简短标题 | Global Average Temperature |
|---|---|
| 图像标题 | Land-ocean temperature index, 1880 to present, with base period 1951-1980. The solid black line is the global annual mean and the solid red line is the five-year lowess smooth. The blue uncertainty bars represents the total (LSAT and SST) annual uncertainty at a 95% confidence interval. [More information on the updated uncertainty model can be found here: Lenssen et al. (2019).] |
| 宽度 | 1440px |
| 高度 | 1000px |
