File:2011- Renewable energy capacity - International Energy Agency.svg

此 SVG 檔案的 PNG 預覽的大小:800 × 450 像素。 其他解析度:320 × 180 像素 | 640 × 360 像素 | 1,024 × 576 像素 | 1,280 × 720 像素 | 2,560 × 1,440 像素 | 1,200 × 675 像素。
原始檔案 (SVG 檔案,表面大小:1,200 × 675 像素,檔案大小:4 KB)
摘要
| 描述 |
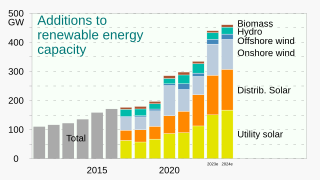
English: Bar chart (column graph) of the number of gigawatts of w:renewable energy capacity (2011- ), as reported by the w:International Energy Agency.
|
||
| 日期 | |||
| 來源 | 自己的作品 | ||
| 作者 | RCraig09 | ||
| 其他版本 |
|


授權條款
我,本作品的著作權持有者,決定用以下授權條款發佈本作品:
此檔案採用創用CC 姓名標示-相同方式分享 4.0 國際授權條款。
- 您可以自由:
- 分享 – 複製、發佈和傳播本作品
- 重新修改 – 創作演繹作品
- 惟需遵照下列條件:
- 姓名標示 – 您必須指名出正確的製作者,和提供授權條款的連結,以及表示是否有對內容上做出變更。您可以用任何合理的方式來行動,但不得以任何方式表明授權條款是對您許可或是由您所使用。
- 相同方式分享 – 如果您利用本素材進行再混合、轉換或創作,您必須基於如同原先的相同或兼容的條款,來分布您的貢獻成品。
檔案歷史
點選日期/時間以檢視該時間的檔案版本。
| 日期/時間 | 縮圖 | 尺寸 | 使用者 | 備註 | |
|---|---|---|---|---|---|
| 目前 | 2023年9月29日 (五) 10:15 | | 1,200 × 675(4 KB) | Jirka Dl | Reverted to version as of 21:33, 25 August 2023 (UTC) - translation will be in separate file |
| 2023年9月6日 (三) 08:00 |  | 1,200 × 675(6 KB) | Jirka Dl | File uploaded using svgtranslate tool (https://svgtranslate.toolforge.org/). Added translation for cs. | |
| 2023年8月25日 (五) 21:33 |  | 1,200 × 675(4 KB) | RCraig09 | Version 5: update to include data, and projected data, for 2024 | |
| 2022年9月15日 (四) 20:17 |  | 1,100 × 700(3 KB) | RCraig09 | Version 4: update with data through 2021 | |
| 2021年5月13日 (四) 20:01 |  | 1,063 × 750(3 KB) | RCraig09 | Version 3: reversed positions of Solar and Wind since Wind showed the greatest increase from 2019 to 2020. . . . Made colors more subdued. | |
| 2021年5月12日 (三) 01:56 |  | 1,063 × 750(3 KB) | RCraig09 | Version 2: Breaking down 2019 and 2020 components . . . Changing title to be more precise | |
| 2021年5月11日 (二) 22:10 |  | 1,000 × 750(2 KB) | RCraig09 | Uploaded own work with UploadWizard |
檔案用途
全域檔案使用狀況
以下其他 wiki 使用了這個檔案:
- bn.wikipedia.org 的使用狀況
- cs.wikipedia.org 的使用狀況
- en.wikipedia.org 的使用狀況
- ig.wikipedia.org 的使用狀況
- ko.wikipedia.org 的使用狀況
- 지속 가능한 에너지
- 사용자:이강철 (WMKR)/심사/기후변화 문서보강 프로젝트/Scottkim06/지속 가능한 에너지/4월 14일
- 사용자:이강철 (WMKR)/심사/기후변화 문서보강 프로젝트/Scottkim06/지속 가능한 에너지/4월 19일
- 사용자:이강철 (WMKR)/심사/기후변화 문서보강 프로젝트/Scottkim06/지속 가능한 에너지/4월 21일
- 사용자:이강철 (WMKR)/심사/기후변화 문서보강 프로젝트/Scottkim06/지속 가능한 에너지/4월 22일
- 사용자:이강철 (WMKR)/심사/기후변화 문서보강 프로젝트/Scottkim06/지속 가능한 에너지/4월 23일
- 사용자:이강철 (WMKR)/심사/기후변화 문서보강 프로젝트/Scottkim06/지속 가능한 에너지/4월 24일
- 사용자:이강철 (WMKR)/심사/기후변화 문서보강 프로젝트/Scottkim06/지속 가능한 에너지/4월 29일
- 사용자:이강철 (WMKR)/심사/기후변화 문서보강 프로젝트/Scottkim06/지속 가능한 에너지/4월 30일
- no.wikipedia.org 的使用狀況
- uz.wikipedia.org 的使用狀況
- zu.wikipedia.org 的使用狀況