File:Ocean heat anomaly map 2020.jpg

預覽大小:700 × 600 像素。 其他解析度:280 × 240 像素 | 560 × 480 像素 | 896 × 768 像素 | 1,195 × 1,024 像素 | 1,400 × 1,200 像素。
原始檔案 (1,400 × 1,200 像素,檔案大小:465 KB,MIME 類型:image/jpeg)
摘要
| 描述 |
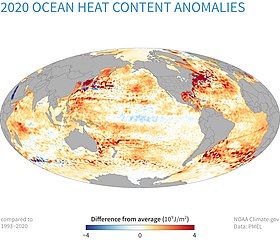
English: Map shows ocean heat anomalies in the upper 700 meters for year 2020 relative to average heat content during years 1993 thru 2020 of the same ocean regions. Regions shown in red (blue) gained (lost) thermal energy in 2020. Most regions showed positive anomalies and the total ocean heat content reached a record-high value in 2020. Image from: Reporting on the State of the Climate in 2020 published September 1, 2020 by Jessica Blunden (NOAA Climate.gov) |
| 日期 | |
| 來源 | https://www.climate.gov/media/13226 |
| 作者 | NOAA Climate.gov |
授權條款
本圖像屬於公有領域,因該作品最初來自於美國國家海洋和大氣管理局職員的職務作品。
|
檔案歷史
點選日期/時間以檢視該時間的檔案版本。
| 日期/時間 | 縮圖 | 尺寸 | 使用者 | 備註 | |
|---|---|---|---|---|---|
| 目前 | 2022年1月7日 (五) 04:42 | | 1,400 × 1,200(465 KB) | Bikesrcool | Uploaded a work by NOAA Climate.gov from https://www.climate.gov/media/13226 with UploadWizard |
檔案用途
下列頁面有用到此檔案:
全域檔案使用狀況
以下其他 wiki 使用了這個檔案:
- en.wikipedia.org 的使用狀況
- ig.wikipedia.org 的使用狀況
- mk.wikipedia.org 的使用狀況