File:Helmholtz solution.png

預覽大小:298 × 598 像素。 其他解析度:119 × 240 像素 | 239 × 480 像素 | 975 × 1,957 像素。
原始檔案 (975 × 1,957 像素,檔案大小:23 KB,MIME 類型:image/png)
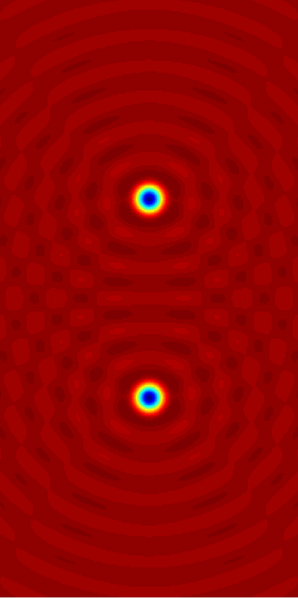
| 描述 | Illustration of en:Helmholtz equation. |
| 日期 | (UTC) |
| 來源 | self-made with en:Matlab. See the source code below. |
| 作者 | Oleg Alexandrov |
| 我,此作品的版權所有人,釋出此作品至公共領域。此授權條款在全世界均適用。 這可能在某些國家不合法,如果是的話: 我授予任何人有權利使用此作品於任何用途,除受法律約束外,不受任何限制。 |
Source code (MATLAB)
% Plot the solution to the Helmholtz equation with a given source
clear all;

Box_x = 3;
Scale = 0.5;
Box_y = Box_x/Scale;

Nx = 200;
Ny = Nx/Scale;

wavenumber = 10;

XX = linspace(-Box_x, Box_x, Nx);
YY = linspace(-Box_y, Box_y, Ny);
hx = XX(2) - XX(1);
hy = YY(2) - YY(1);
[X, Y] = meshgrid(XX, YY);

Source_size  = 0.5;
Source_shift = 2;
Source =  max(Source_size^2 - X.^2-(Y-Source_shift).^2, 0) + max(Source_size^2 - X.^2-(Y+Source_shift).^2, 0) ;

% plot the source
figure(1); clf; hold on; axis equal; axis off;
imagesc(Source);


% plot the solution to the Helmholtz equation
I = sqrt(-1);
Field = 0*X;

[m, n] = size(Source);
for i=1:m
   i
   for j=1:n

      if Source(i, j) ~= 0

	 x0 = X(i, j);
	 y0 = Y(i, j);

	 % add the contribution from the current source
	 Field = Field + (I/4)*besselh(0, 1, wavenumber*sqrt((X-x0).^2+(Y-y0).^2) + eps)*Source(i, j)*hx*hy;
      end

   end
end


figure(2); clf; hold on; axis equal; axis off;
imagesc(real(Field));

% Save to disk and convert to png right away
figure(1);
saveas(gcf, 'Helmholtz_source.eps', 'psc2');
%! convert -density 200 Helmholtz_source.eps Helmholtz_source.png

figure(2);
saveas(gcf, 'Helmholtz_solution.eps', 'psc2');
%! convert -density 200 Helmholtz_solution.eps Helmholtz_solution.png

|
本圖片是以PNG、GIF或JPEG格式上傳。然而,其中包含的資料或訊息,應該重新建立成可縮放向量圖形(SVG)檔案,以更有效率或更準確的方式儲存。如有可能,請上傳本圖片的SVG格式版本。在上傳之後,請修改維基各姊妹計畫中所有使用舊版圖片的條目(列在圖像連結章節中),替換為新版圖片,並在舊圖片的描述頁中加入{{Vector version available|新圖片名稱.svg}}模板,同時移除本模板。
|
檔案歷史
點選日期/時間以檢視該時間的檔案版本。
| 日期/時間 | 縮圖 | 尺寸 | 用戶 | 備註 | |
|---|---|---|---|---|---|
| 目前 | 2007年7月7日 (六) 19:50 | | 975 × 1,957(23 KB) | Oleg Alexandrov | Tweak |
| 2007年7月7日 (六) 04:18 |  | 500 × 989(22 KB) | Oleg Alexandrov | Higher res. | |
| 2007年7月7日 (六) 03:59 |  | 500 × 989(15 KB) | Oleg Alexandrov | {{Information |Description=Illustration of en:Helmholtz equation. |Source=self-made with en:Matlab. See the source code below. |Date=03:56, 7 July 2007 (UTC) |Author= Oleg Alexandrov }} {{PD-self}} ==MATLAB source code |
檔案用途
下列頁面有用到此檔案:
全域檔案使用狀況
以下其他 wiki 使用了這個檔案:
- ar.wikipedia.org 的使用狀況
- ca.wikipedia.org 的使用狀況
- en.wikipedia.org 的使用狀況
- et.wikipedia.org 的使用狀況
- fa.wikipedia.org 的使用狀況
- fr.wikipedia.org 的使用狀況
- ko.wikipedia.org 的使用狀況
- no.wikipedia.org 的使用狀況
- pt.wikipedia.org 的使用狀況
- sq.wikipedia.org 的使用狀況
- vi.wikipedia.org 的使用狀況
- www.wikidata.org 的使用狀況