File:Timeline of weekly confirmed COVID-19 deaths in the United States.svg

此 SVG 檔案的 PNG 預覽的大小:800 × 565 像素。 其他解析度:320 × 226 像素 | 640 × 452 像素 | 1,024 × 723 像素 | 1,280 × 904 像素 | 2,560 × 1,807 像素。
原始檔案 (SVG 檔案,表面大小:850 × 600 像素,檔案大小:72 KB)
摘要
| 描述 |
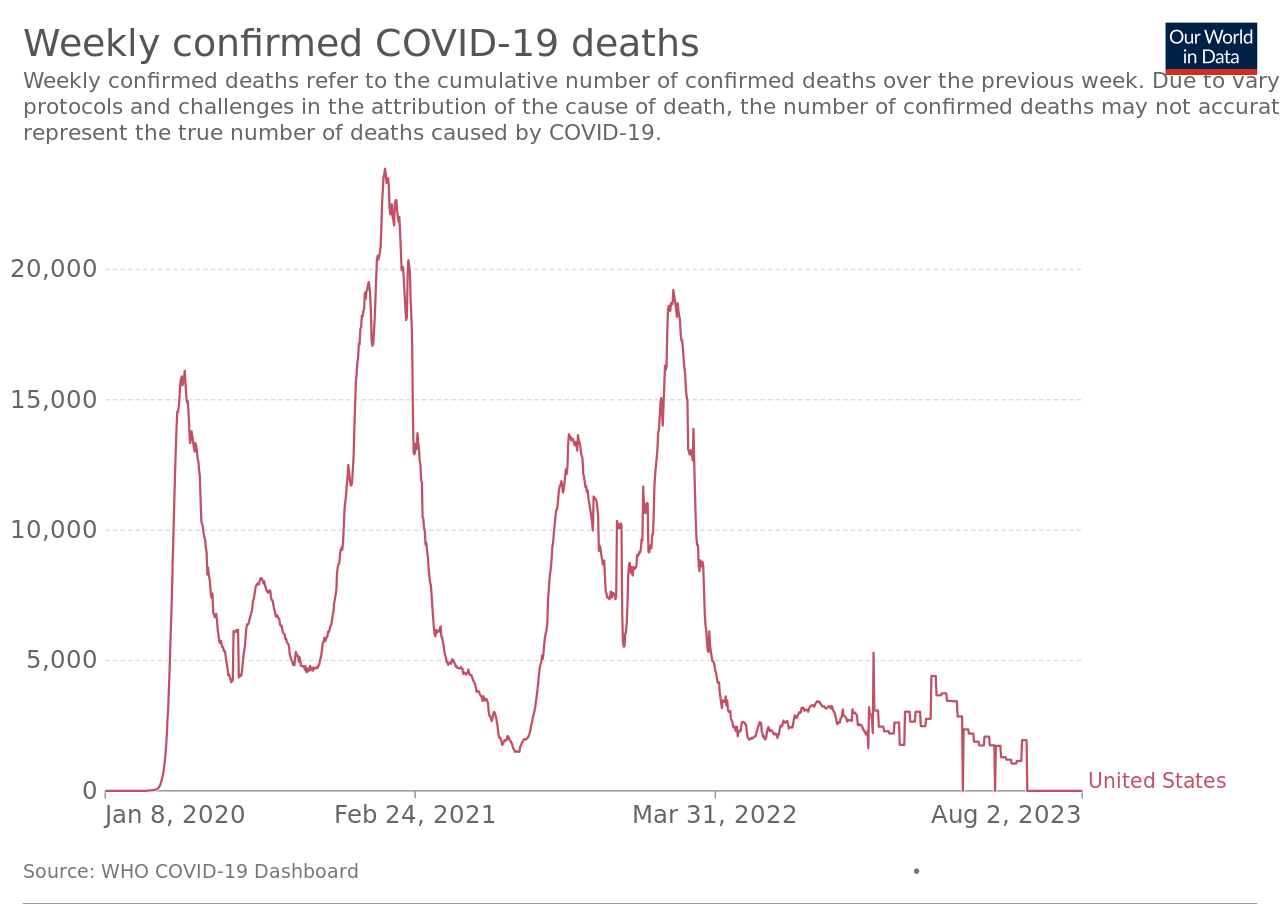
English: Timeline of weekly confirmed COVID-19 deaths in the United States. See end date on graph. Go to the source link below. The graph at the source is interactive and provides more detail. For example, run your cursor over the graph for the date and weekly count. The sources tab there links to: COVID-19 Data Repository by the Center for Systems Science and Engineering (CSSE) at Johns Hopkins University. The table tab has weekly numbers by country. |
| 日期 | is the date of the first upload to the Commons. See the file history below for the most recent upload date. Please upload new versions. Use the upload link at the end of the file history list. |
| 來源 | 個人作品,使用: https://ourworldindata.org/grapher/weekly-covid-deaths?tab=chart&country=~USA - Click on the download tab. |
| 作者 | Our World In Data. See Wikipedia: Our World in Data. |
| SVG開發 |
授權條款
此檔案採用創用CC 姓名標示 4.0 國際授權條款。
- 您可以自由:
- 分享 – 複製、發佈和傳播本作品
- 重新修改 – 創作演繹作品
- 惟需遵照下列條件:
- 姓名標示 – 您必須指名出正確的製作者,和提供授權條款的連結,以及表示是否有對內容上做出變更。您可以用任何合理的方式來行動,但不得以任何方式表明授權條款是對您許可或是由您所使用。
檔案歷史
點選日期/時間以檢視該時間的檔案版本。
| 日期/時間 | 縮圖 | 尺寸 | 用戶 | 備註 | |
|---|---|---|---|---|---|
| 目前 | 2023年8月8日 (二) 21:58 | | 850 × 600(72 KB) | Timeshifter | latest |
| 2023年5月19日 (五) 03:06 |  | 850 × 600(69 KB) | Timeshifter | Latest | |
| 2023年2月12日 (日) 22:58 |  | 850 × 600(63 KB) | Timeshifter | Latest | |
| 2023年1月14日 (六) 04:58 |  | 850 × 600(61 KB) | Timeshifter | Latest graph | |
| 2023年1月5日 (四) 06:55 |  | 850 × 600(61 KB) | Timeshifter | latest graph from source. | |
| 2022年12月11日 (日) 15:08 |  | 850 × 600(60 KB) | Timeshifter | latest graph from source. | |
| 2022年11月21日 (一) 23:54 |  | 850 × 600(60 KB) | Timeshifter | latest graph from source. | |
| 2022年10月23日 (日) 10:31 |  | 850 × 600(58 KB) | Timeshifter | latest graph from source. | |
| 2022年10月6日 (四) 23:40 |  | 850 × 600(58 KB) | Timeshifter | latest graph from source. | |
| 2022年8月23日 (二) 11:24 |  | 850 × 600(56 KB) | Timeshifter | Latest graph from source |
檔案用途
下列頁面有用到此檔案:
全域檔案使用狀況
以下其他 wiki 使用了這個檔案:
- en.wikipedia.org 的使用狀況
- ja.wikipedia.org 的使用狀況
- pl.wikipedia.org 的使用狀況