File:Variation-couple-uf.svg

此SVG文件的PNG预览的大小:600 × 480像素。 其他分辨率:300 × 240像素 | 960 × 768像素 | 1,280 × 1,024像素 | 2,560 × 2,048像素。
原始文件 (SVG文件,尺寸为600 × 480像素,文件大小:14 KB)
摘要
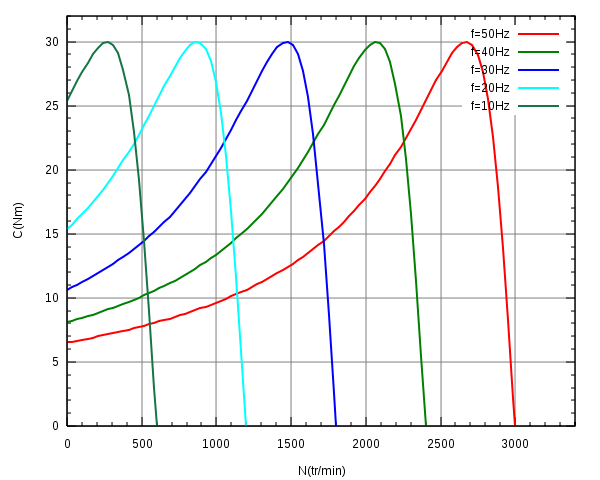
| 描述 | variation du couple/vitesse lors de la commande en U/F d'une machine asynchrone | ||||||||
| 日期 | |||||||||
| 来源 | 自己的作品 | ||||||||
| 作者 | Yves-Laurent Allaert | ||||||||
| 授权 (二次使用本文件) |
我,本作品著作权人,特此采用以下许可协议发表本作品:
您可以选择您需要的许可协议。 |

Gnuplot script
Save this script to file "Variation-couple-uf" then run the command line "gnuplot couple_mas", you will get Variation-couple-uf.svg, if you have well installed gnuplot 4.0 or later.
set terminal svg
set encoding iso_8859_1
set border
set mxtics
set mytics
set grid xtics ytics
set xlabel "N(tr/min)"
set ylabel "C(Nm)"
set xrange [0:3400]
set yrange [0:32]
set output "Variation-couple-uf.svg"
cmax=30
gmax=0.11
fn=50
gm(x) = gmax*fn/x
g(x,fs) = 1 - x/(60*fs)
Tem(x,fs)  = 2*cmax*1/(gm(fs)/g(x,fs)+g(x,fs)/gm(fs))
plot Tem(x,50) title "f=50Hz" with lines lw 2, \
     Tem(x,40) title "f=40Hz" with lines lw 2, \
     Tem(x,30) title "f=30Hz" with lines lw 2, \
     Tem(x,20) title "f=20Hz" with lines lw 2, \
     Tem(x,10) title "f=10Hz" with lines lw 2
文件历史
点击某个日期/时间查看对应时刻的文件。
| 日期/时间 | 缩略图 | 大小 | 用户 | 备注 | |
|---|---|---|---|---|---|
| 当前 | 2007年5月25日 (五) 09:11 | | 600 × 480(14 KB) | Yves-Laurent | == Summary == {{Information |Description= variation du couple/vitesse lors de la commande en U/F d'une machine asynchrone |Source=own work/travail personnel |Date=25/05/2007 |Author=Yves-Laurent Allaert |Permission={{self2|GFDL|cc-by-sa-2.5,2.0,1.0}} }} |
文件用途
以下页面使用本文件:
全域文件用途
以下其他wiki使用此文件:
- en.wikipedia.org上的用途
- eo.wikipedia.org上的用途
- fr.wikipedia.org上的用途
- fr.wikiversity.org上的用途
- hi.wikipedia.org上的用途
- tr.wikipedia.org上的用途