File:1958 Pacific typhoon season summary map.png

預覽大小:800 × 600 像素。 其他解析度:320 × 240 像素 | 640 × 480 像素 | 1,024 × 768 像素 | 1,280 × 960 像素 | 2,560 × 1,920 像素 | 3,000 × 2,250 像素。
原始檔案 (3,000 × 2,250 像素,檔案大小:4.77 MB,MIME 類型:image/png)
| 描述 |
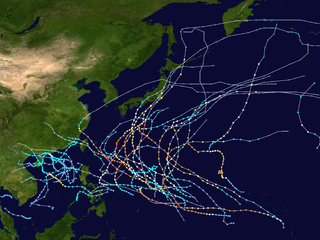
English: This map shows the tracks of all tropical cyclones in the 1958 Pacific typhoon season. The points show the location of each storm at 6-hour intervals. The colour represents the storm's maximum sustained wind speeds as classified in the Saffir-Simpson Hurricane Scale (see below), and the shape of the data points represent the type of the storm.
Tropical depression (≤38 mph, ≤62 km/h)
Tropical storm (39–73 mph, 63–118 km/h)
Category 1 (74–95 mph, 119–153 km/h)
Category 2 (96–110 mph, 154–177 km/h)
Category 3 (111–129 mph, 178–208 km/h)
Category 4 (130–156 mph, 209–251 km/h)
Category 5 (≥157 mph, ≥252 km/h)
Unknown
Storm type |
| 來源 | Created using Wikipedia:WikiProject Tropical cyclones/Tracks. The background image is from NASA [1]. The tracking data |
| 作者 | Supportstorm |

|
该文件可能会更新以反映新信息 如果您希望在不镜像新更新的情况下使用该文件的特定版本,请将所需版本作为单独的文件上传。 |
| 此作品已由其作者,Supportstorm,釋出至公有領域。此授權條款在全世界均適用。 這可能在某些國家不合法,如果是的話: Supportstorm授予任何人有權利使用此作品於任何用途,除受法律約束外,不受任何限制。 |
檔案歷史
點選日期/時間以檢視該時間的檔案版本。
| 日期/時間 | 縮圖 | 尺寸 | 使用者 | 備註 | |
|---|---|---|---|---|---|
| 目前 | 2014年9月10日 (三) 10:13 | | 3,000 × 2,250(4.77 MB) | Supportstorm | Smaller dot size |
| 2013年10月5日 (六) 17:54 |  | 3,000 × 2,250(4.75 MB) | Supportstorm | {{Hurricane season auto track map|start=|end=|source=IBTrACS|type=typhoon|basin=Pacific|year=1958|author=Supportstorm}} |
檔案用途
下列頁面有用到此檔案:
全域檔案使用狀況
以下其他 wiki 使用了這個檔案:
- en.wikipedia.org 的使用狀況
- ko.wikipedia.org 的使用狀況
- pt.wikipedia.org 的使用狀況
- th.wikipedia.org 的使用狀況
- vi.wikipedia.org 的使用狀況