File:20200509 Emergence of temperatures from range of normal historical variability - tropical vs northern Americas (Hawkins).gif

預覽大小:800 × 600 像素。 其他解析度:320 × 240 像素 | 640 × 480 像素 | 1,000 × 750 像素。
原始檔案 (1,000 × 750 像素,檔案大小:4.37 MB,MIME 類型:image/gif、循環、90 畫格、6.3秒)
.gif?uselang=zh-tw)
.gif?uselang=zh-tw)
.gif?action=history&uselang=zh-tw)
.gif)
摘要
| 描述 |
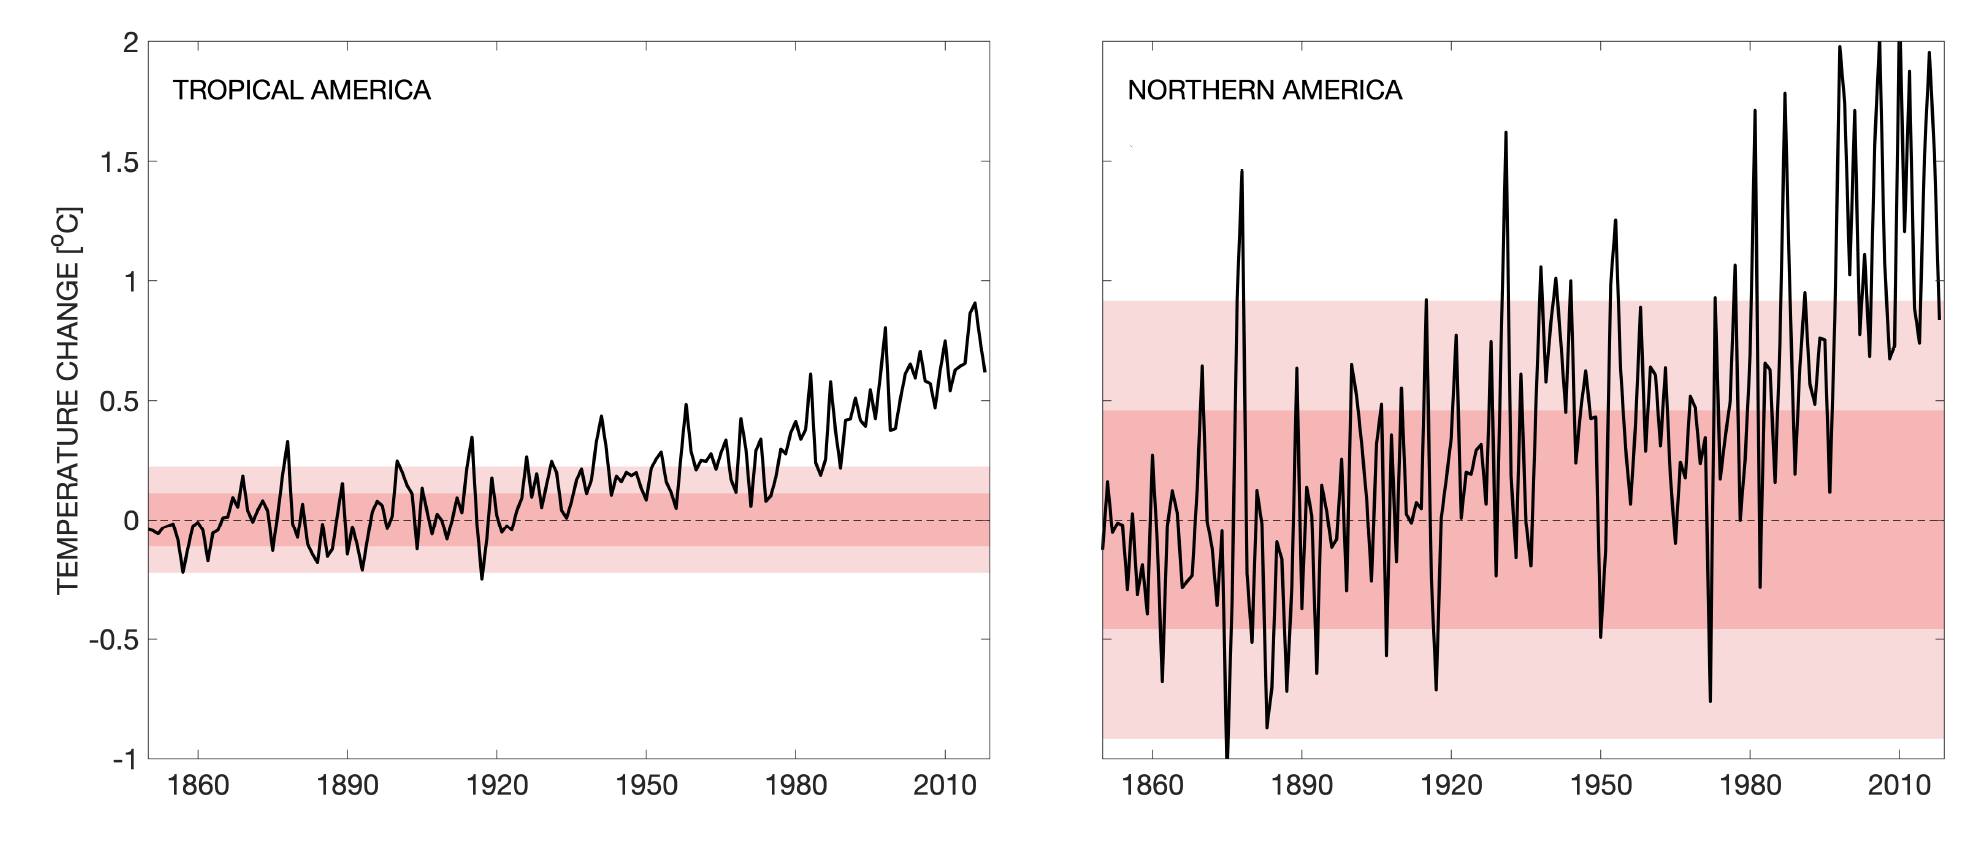
English: Animated graphic of temperature changes in tropical America and in Northern America, atop 1 and 2 standard deviations of normal variability.
|
| 日期 | |
| 來源 | 自己的作品 |
| 作者 | RCraig09 |
| 其他版本 |
.svg) (non-animated, SVG predecessor, showing both graphs at once) |
授權條款
Climate Lab Book source (Ed Hawkins) states:
"These blog pages & images are licensed under a Creative Commons Attribution-ShareAlike 4.0 International License."
此檔案採用創用CC 姓名標示-相同方式分享 4.0 國際授權條款。
- 您可以自由:
- 分享 – 複製、發佈和傳播本作品
- 重新修改 – 創作演繹作品
- 惟需遵照下列條件:
- 姓名標示 – 您必須指名出正確的製作者,和提供授權條款的連結,以及表示是否有對內容上做出變更。您可以用任何合理的方式來行動,但不得以任何方式表明授權條款是對您許可或是由您所使用。
- 相同方式分享 – 如果您利用本素材進行再混合、轉換或創作,您必須基於如同原先的相同或兼容的條款,來分布您的貢獻成品。
Uploader's graphical rendition:
我,本作品的著作權持有者,決定用以下授權條款發佈本作品:
此檔案採用創用CC 姓名標示-相同方式分享 4.0 國際授權條款。
- 您可以自由:
- 分享 – 複製、發佈和傳播本作品
- 重新修改 – 創作演繹作品
- 惟需遵照下列條件:
- 姓名標示 – 您必須指名出正確的製作者,和提供授權條款的連結,以及表示是否有對內容上做出變更。您可以用任何合理的方式來行動,但不得以任何方式表明授權條款是對您許可或是由您所使用。
- 相同方式分享 – 如果您利用本素材進行再混合、轉換或創作,您必須基於如同原先的相同或兼容的條款,來分布您的貢獻成品。
檔案歷史
點選日期/時間以檢視該時間的檔案版本。
| 日期/時間 | 縮圖 | 尺寸 | 使用者 | 備註 | |
|---|---|---|---|---|---|
| 目前 | 2020年5月9日 (六) 21:11 | | 1,000 × 750(4.37 MB) | RCraig09 | Uploaded own work with UploadWizard |
檔案用途
下列頁面有用到此檔案:
全域檔案使用狀況
以下其他 wiki 使用了這個檔案:
- en.wikipedia.org 的使用狀況
.gif)