File:2020 Worldwide CO2 Emissions (by region, per capita), variwide diagram.png

原始檔案 (3,000 × 2,000 像素,檔案大小:706 KB,MIME 類型:image/png)
,_variwide_diagram.png?uselang=zh-tw)
,_variwide_diagram.png?uselang=zh-tw)
,_variwide_diagram.png?action=history&uselang=zh-tw)
,_variwide_diagram.png)
摘要
| 描述 |
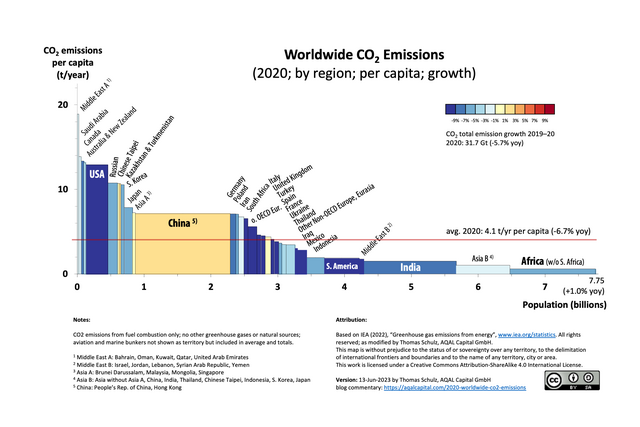
English: The variwide chart allows the visualization of a multitude of data dimensions in one easy-to-read diagram. These data dimensions are:
- Individual country data, such as China, South Africa, or the USA, or a group of countries such as the Middle East, Africa, or Australia/New Zealand, - Population by country or group of countries, - Per capita CO2 emissions, and - CO2 emissions growth year-over-year The total CO2 emissions of a region are represented as a rectangular area. The height of each rectangle is proportional to the CO2 emissions per capita and the width is proportional to the population of the represented region. The regions are sorted by CO2 emissions per capita, from the highest to the lowest. The color of the rectangles indicate their growth rate: “heating up” is represented from light red to dark red, and “cooling down” goes from light blue to dark blue. Based on IEA data from IEA (2022) “Greenhouse gas emissions from energy”, https://www.iea.org/statistics. All rights reserved; as modified by Thomas Schulz, AQAL Capital GmbH. https://aqalcapital.com/2020-worldwide-co2-emissions/ This map is without prejudice to the status of or sovereignty over any territory, to the delimitation of international frontiers and boundaries and to the name of any territory, city or area. License: This work is licensed under a Creative Commons Attribution-ShareAlike 4.0 International License (CC BY-SA 4.0) |
| 日期 | |
| 來源 | 自己的作品 |
| 作者 | Tom.schulz |
授權條款
- 您可以自由:
- 分享 – 複製、發佈和傳播本作品
- 重新修改 – 創作演繹作品
- 惟需遵照下列條件:
- 姓名標示 – 您必須指名出正確的製作者,和提供授權條款的連結,以及表示是否有對內容上做出變更。您可以用任何合理的方式來行動,但不得以任何方式表明授權條款是對您許可或是由您所使用。
- 相同方式分享 – 如果您利用本素材進行再混合、轉換或創作,您必須基於如同原先的相同或兼容的條款,來分布您的貢獻成品。
檔案歷史
點選日期/時間以檢視該時間的檔案版本。
| 日期/時間 | 縮圖 | 尺寸 | 使用者 | 備註 | |
|---|---|---|---|---|---|
| 目前 | 2023年6月13日 (二) 15:04 | | 3,000 × 2,000(706 KB) | Tom.schulz | added missing data label for S. America |
| 2022年12月21日 (三) 18:40 |  | 2,680 × 1,704(683 KB) | Femke | remove superfluous white space | |
| 2022年11月12日 (六) 11:42 |  | 3,000 × 2,000(700 KB) | Tom.schulz | Uploaded own work with UploadWizard |
檔案用途
下列頁面有用到此檔案:
全域檔案使用狀況
以下其他 wiki 使用了這個檔案:
- en.wikipedia.org 的使用狀況
- ha.wikipedia.org 的使用狀況
- id.wikipedia.org 的使用狀況
- sw.wiktionary.org 的使用狀況
,_variwide_diagram.png)