File:PbSO4 solubility graph.png

預覽大小:800 × 489 像素。 其他解析度:320 × 196 像素 | 640 × 391 像素 | 1,024 × 626 像素 | 1,436 × 878 像素。
原始檔案 (1,436 × 878 像素,檔案大小:12 KB,MIME 類型:image/png)

|
本圖片是以PNG、GIF或JPEG格式上傳。然而,其中包含的資料或訊息,應該重新建立成可縮放向量圖形(SVG)檔案,以更有效率或更準確的方式儲存。如有可能,請上傳本圖片的SVG格式版本。在上傳之後,請修改維基各姊妹計畫中所有使用舊版圖片的條目(列在圖像連結章節中),替換為新版圖片,並在舊圖片的描述頁中加入{{Vector version available|新圖片名稱.svg}}模板,同時移除本模板。
|
摘要
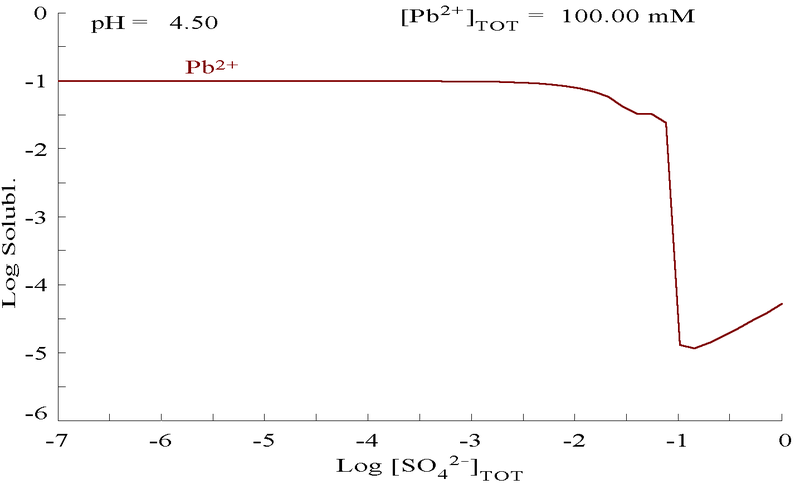
| 描述 | Plot showing aqueous concentration of dissolved Pb2+ (max available concentration = 0.1M) as a function of SO42− at pH=4.5, which is the max pH at which 0.1M Pb2+ can exist. |
| 日期 | |
| 來源 | self-made using Hydra/Medusa software, freely downloadable from [1]. Edited using Gimp 2.2 |
| 作者 | Karlhahn |
授權條款
| 我,此作品的版權所有人,釋出此作品至公共領域。此授權條款在全世界均適用。 這可能在某些國家不合法,如果是的話: 我授予任何人有權利使用此作品於任何用途,除受法律約束外,不受任何限制。 |
檔案歷史
點選日期/時間以檢視該時間的檔案版本。
| 日期/時間 | 縮圖 | 尺寸 | 使用者 | 備註 | |
|---|---|---|---|---|---|
| 目前 | 2010年7月2日 (五) 11:48 | | 1,436 × 878(12 KB) | Materialscientist | crop whitespace |
| 2007年9月28日 (五) 03:20 |  | 1,680 × 1,050(14 KB) | Karlhahn | New version thickens plot trace. {{Information |Description=Plot showing aqueous concentration of dissolved Pb<sup>2+</sub> (max available concentration = 0.1M) as a function of SO<sub>4</sub><sup>2−</sup> at pH=4.5, which is the max pH at which 0.1M P | |
| 2007年9月28日 (五) 02:49 |  | 1,680 × 1,050(14 KB) | Karlhahn | {{Information |Description=Plot showing aqueous concentration of dissoved Pb<sup>2+</sub> (max available concentration = 0.1M) as a function of SO<sub>4</sub><sup>2−</sup> at pH=4.5, which is the max concentration at which 0.1M Pb<sup>2+</sup> can exist |
檔案用途
下列頁面有用到此檔案:
全域檔案使用狀況
以下其他 wiki 使用了這個檔案:
- cs.wikipedia.org 的使用狀況
- en.wikipedia.org 的使用狀況
- vi.wikipedia.org 的使用狀況