File:Piecharts.svg

此 SVG 檔案的 PNG 預覽的大小:689 × 494 像素。 其他解析度:320 × 229 像素 | 640 × 459 像素 | 1,024 × 734 像素 | 1,280 × 918 像素 | 2,560 × 1,835 像素。
原始檔案 (SVG 檔案,表面大小:689 × 494 像素,檔案大小:39 KB)
摘要
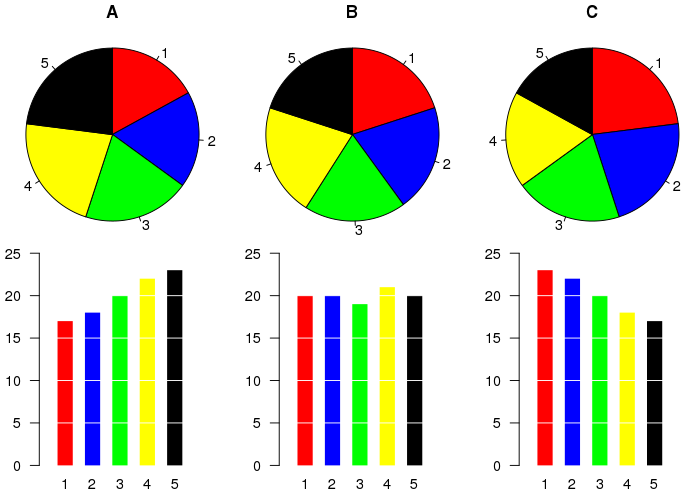
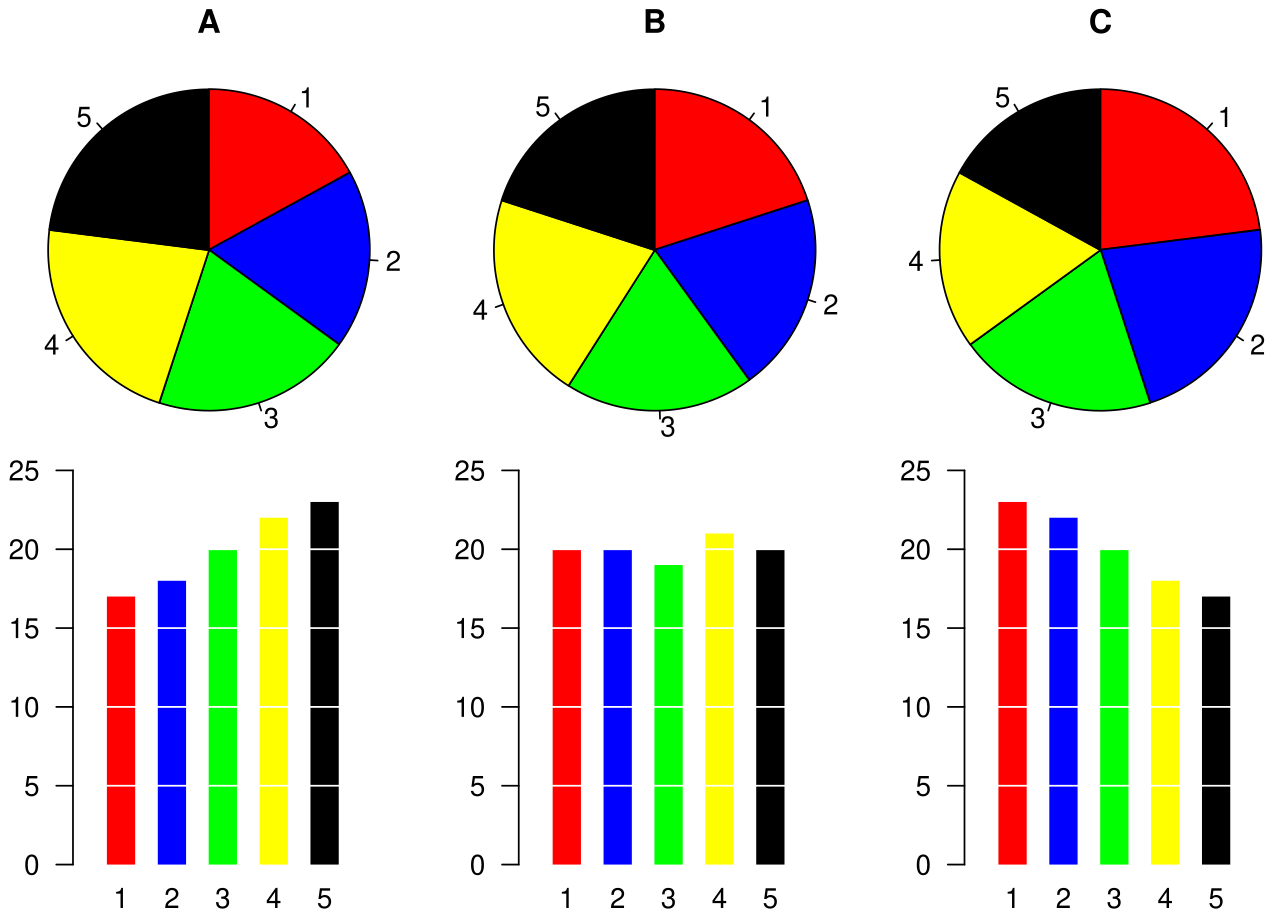
Example of a pie chart, along with a bar plot showing the same data and indicating that the pie chart is not the best possible chart for this particular dataset.
The graphic was created by User:Schutz for Wikipedia on 28 August 2007 using the R statistical project. The program that generated the graphic is given below. The graph was exported in postscript format, converted to SVG using the pstoedit command, and the layout was slightly modified using Inkscape before upload.
本vector image使用R創作v+pstoedit+Inkscape:
授權條款
此檔案採用創用CC 姓名標示 1.0 通用版授權條款。
- 您可以自由:
- 分享 – 複製、發佈和傳播本作品
- 重新修改 – 創作演繹作品
- 惟需遵照下列條件:
- 姓名標示 – 您必須指名出正確的製作者,和提供授權條款的連結,以及表示是否有對內容上做出變更。您可以用任何合理的方式來行動,但不得以任何方式表明授權條款是對您許可或是由您所使用。
檔案歷史
點選日期/時間以檢視該時間的檔案版本。
| 日期/時間 | 縮圖 | 尺寸 | 使用者 | 備註 | |
|---|---|---|---|---|---|
| 目前 | 2007年8月28日 (二) 08:33 | | 689 × 494(39 KB) | Schutz | == Summary == Example of a pie chart, along with a bar plot showing the same data and indicating that the pie chart is not the best possible chart for this particular dataset. The graphic was created by User:Schutz for Wikipedia on 28 August 2007 usi |
檔案用途
下列頁面有用到此檔案:
全域檔案使用狀況
以下其他 wiki 使用了這個檔案:
- cy.wikipedia.org 的使用狀況
- el.wikipedia.org 的使用狀況
- en.wikipedia.org 的使用狀況
- eu.wikipedia.org 的使用狀況
- fi.wikipedia.org 的使用狀況
- he.wikipedia.org 的使用狀況
- he.wikibooks.org 的使用狀況
- ja.wikipedia.org 的使用狀況
- pl.wikipedia.org 的使用狀況
- pt.wikipedia.org 的使用狀況
- ta.wikipedia.org 的使用狀況
- tr.wikipedia.org 的使用狀況
- uk.wikipedia.org 的使用狀況