User:AndyAndyAndyAlbert/沙盒/Q

在大西洋、墨西哥湾及太平洋東部所形成的熱帶氣旋,大多會影響美國本土,並為當地帶來降雨。目前全國因此而錄得高降雨量的地理位置分佈於美國墨西哥灣沿岸地區,以及部分位於美國東岸的低窪地區;錄得中等降雨量的地理位置則分佈於美國西南部、新英格蘭及美國中西部。由於北美大平原北部及美國西北部距離大西洋颶風季與太平洋颶風季的熱帶氣旋生成帶較遠,因此當地因熱帶氣旋而造成的降雨量最低。
美國有紀錄以來,造成最高降雨量的熱帶氣旋為2017年颶風哈維,在德克薩斯州南部錄得了60.58英寸(1,539 mm)的雨量。熱帶風暴克勞德特則保持了全國24小時降雨量的紀錄,在德克薩斯州阿爾文市錄得了42.00英寸(1,067 mm)的雨量。
降雨量最高 编辑

| 降雨量 | 风暴 | 地点 | 参 | |
|---|---|---|---|---|
| 排名 | mm | |||
| 1 | 1538.7 | 2017年颶風哈維 | 德克薩斯州納德蘭 | [1] |
| 2 | 1473 | 2018年颶風萊恩 | 夏威夷卡胡娜瀑布 | [2] |
| 3 | 1321 | 1950年颶風凱奇 | 夏威夷卡納洛胡盧胡盧林務區 | [3] |
| 4 | 1219 | 1978年熱帶風暴阿米莉亞 | 德克薩斯州梅迪納縣 | [1] |
| 5 | 1148 | 1950年颶風義斯 | 佛羅里達州岩克鎮 | [1] |
| 6 | 1143 | 1979年熱帶風暴克勞德特 | 德克薩斯州阿爾文 | [1] |
| 7 | 1096 | 2019年熱帶風暴伊梅爾達 | 德克薩斯州傑佛遜縣 | [4] |
| 8 | 1058.7 | 1970年15號熱帶低氣壓 | 波多黎各哈尤亞 | [1] |
| 9 | 1033 | 2001年热带风暴阿利森 | 德克薩斯州西北傑佛遜 | [1] |
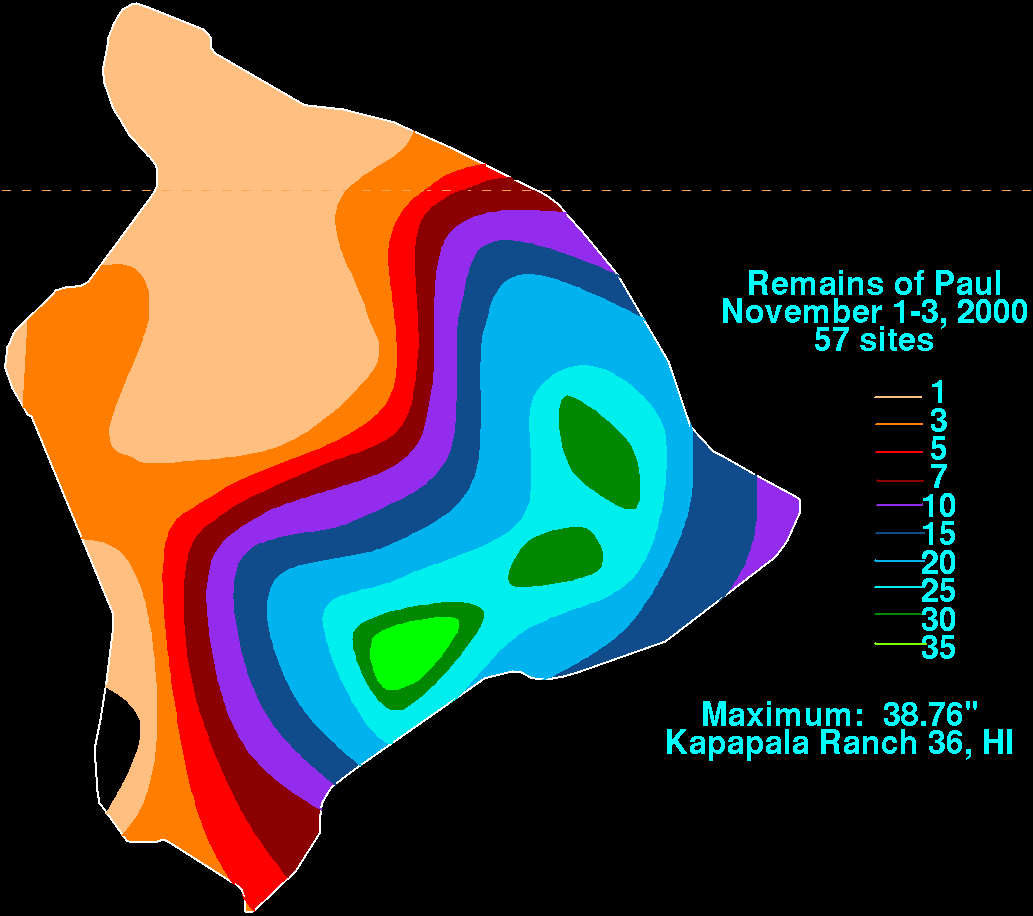
| 10 | 985 | 2000年熱帶風暴保羅 | 夏威夷卡帕拉牧場36號 | [5] |
美國本土最高降雨量 编辑
下列為自1950年起,對美國本土造成最高降雨量的十個熱帶氣旋。

| 降雨量 | 风暴 | 地点 | 参 | |
|---|---|---|---|---|
| 排名 | mm | |||
| 1 | 1538.7 | 2017年颶風哈維 | 德克薩斯州納德蘭 | [1] |
| 2 | 1219 | 1978年熱帶風暴阿米莉亞 | 德克薩斯州梅迪納縣 | [1] |
| 3 | 1148 | 1950年颶風義斯 | 佛羅里達州岩克鎮 | [1] |
| 4 | 1143 | 1979年熱帶風暴克勞德特 | 德克薩斯州阿爾文 | [1] |
| 5 | 1096 | 2019年熱帶風暴伊梅爾達 | 德克薩斯州傑佛遜縣 | [6] |
| 6 | 1033 | 2001年热带风暴阿利森 | 德克薩斯州西北傑佛遜 | [1] |
| 7 | 977 | 1998年飓风乔治 | 佛羅里達州蒙森 | [1] |
| 8 | 932.4 | 1997年飓风丹尼 | 阿拉巴馬州多芬島 | [1] |
| 9 | 912.6 | 2018年颶風佛羅倫斯 | 北卡羅萊納州伊麗莎白鎮 | [7] |
| 10 | 756 | 1960年無名 | 德克薩斯州拉瓦卡港 | [1] |
Alabama 编辑
The wettest tropical cyclone to hit the state of Alabama was Hurricane Danny, which stalled over Mobile Bay for over 24 hours.[8]

| 降雨量 | 风暴 | 地点 | 参 | ||
|---|---|---|---|---|---|
| 排名 | mm | ||||
| 1 | 932.4 | 36.71 | Danny 1997 | Dauphin Island Sea Lab | Template:Tropical Cyclone Point Maxima[1] |
| 2 | 753.4 | 29.66 | Georges 1998 | Bay Minette | [9] |
| 3 | 574.8 | 22.63 | Alberto 1994 | Enterprise 5 NNW | [9] |
| 4 | 493.3 | 19.42 | Opal 1995 | Brewton 3 ENE | [1] |
| 5 | 469.9 | 18.50 | 1926 Miami hurricane | Bay Minette | [10] |
| 6 | 428.0 | 16.85 | Debbie 1965 | Mobile | [1] |
| 7 | 420.6 | 16.56 | Unnamed 1987 | Brewton 3 SSE | [9] |
| 8 | 408.7 | 16.09 | Beryl 1988 | Dauphin Island #2 | [1] |
| 9 | 393.7 | 15.50 | Tropical Storm Two 1931 | Seven Hill | [10] |
| 10 | 355.4 | 13.99 | Isaac 2012 | Grand Bay | [11] |
Alaska 编辑
No storm has ever affected Alaska as a tropical cyclone, but extratropical remnants of tropical cyclones have brought heavy rainfall to the state. Examples include the extratropical remnants of Hurricane Fico in 1978.[12]
American Samoa 编辑

Tropical cyclones affect the island chain with tropical storm-force winds once every three years, on average.[13] The wettest known cyclone to affect the island group occurred early in 1966, when nearly 19英寸(480毫米) fell at Vaipito.[1]
Arizona 编辑
Hurricane Nora was the last tropical cyclone to enter the United States from Mexico at tropical storm strength.[14] The rainfall which fell across the Harquahala Mountains led to the state's 24-hour rainfall record.[15]

Arkansas 编辑
Although having weakened significantly by the time it reached the state, the slow movement of Hurricane Barry over Arkansas led to a widespread and significant flooding event. Murfreesboro saw the greatest rainfall accumulation at 14.58 inches (370.3 mm), which is the highest total ever recorded from a tropical cyclone in the state of Arkansas.[16]

| 降雨量 | 风暴 | 地点 | 参 | ||
|---|---|---|---|---|---|
| 排名 | mm | ||||
| 1 | 421.4 | 16.59 | Barry 2019 | Dierks | [16] |
| 2 | 353.3 | 13.91 | Allison 1989 | Portland | [9] |
| 3 | 349.8 | 13.77 | Bertha 1957 | Damascus 2 NNE | [17] |
| 4 | 298.5 | 11.75 | Bonnie 1986 | El Dorado Regional AP | [9] |
| 5 | 298.2 | 11.74 | Gustav 2008 | Eudora/Bayou Macon | [18] |
| 6 | 286.8 | 11.29 | Isaac 2012 | White Hall 0.8 SE | [11] |
| 7 | 283.5 | 11.16 | Unnamed 1960 | Clarendon | [9] |
| 8 | 265.4 | 10.45 | Frances 1998 | Sparkman | [9] |
| 9 | 253.0 | 9.96 | Harvey 2017 | Watson 9 N | [19] |
| 10 | 248.9 | 9.80 | Hurricane One, 1942 | Springbank | [10] |
California 编辑
One of five known eastern Pacific tropical cyclones to bring tropical storm-force winds to the Southwest,[20] Hurricane Kathleen accelerated northward ahead of an upper level trough, spreading heavy rains into the transverse ranges of southern California.[21]

| 降雨量 | 风暴 | 地点 | 参 | ||
|---|---|---|---|---|---|
| 排名 | mm | ||||
| 1 | 374.9 | 14.76 | Kathleen 1976 | San Gorgonio | [22] |
| 2 | 294.6 | 11.60 | 1939 California tropical storm | Mount Wilson | [23] |
| 3 | 189.2 | 7.45 | Doreen 1977 | Mount San Jacinto | [22] |
| 4 | 182.6 | 7.19 | Olivia 1982 | Grant Grove | [22] |
| 5 | 178.1 | 7.01 | Norman 1978 | Lodgepole | [22] |
| 6 | 88.1 | 3.47 | Nora 1997 | Beaumont 1 E | [22] |
| 7 | 76.5 | 3.01 | Isis 1998 | Balch Power House | [22] |
| 8 | 60.7 | 2.39 | Linda 2015 | Los Angeles | [24] |
| 9 | 55.1 | 2.17 | Ignacio 1997 | Three Peaks | [1] |
| 10 | 42.2 | 1.66 | Lester 1992 | Parker Reservoir | [22] |
Colorado 编辑
Few tropical cyclone remnants originating from the eastern Pacific make it as far north as Colorado. Javier dropped locally heavy rainfall exceeding 4英寸(100毫米) over the higher terrain of western Colorado in 2004.[22]

| 降雨量 | 风暴 | 地点 | 参 | ||
|---|---|---|---|---|---|
| 排名 | mm | ||||
| 1 | 135.9 | 5.35 | Lester 1992 | Wolf Creek Pass 1 E | [22] |
| 2 | 109.2 | 4.30 | Javier 2004 | Beartown | [22] |
| 3 | 68.6 | 2.70 | Blanca 2015 | Paonia 15 NW | [22] |
| 4 | 48.3 | 1.90 | Dolly 2008 | Her | [22] |
Connecticut 编辑
While Hurricane Diane is wettest known tropical cyclone to impact New England, the 1938 New England hurricane produced the most rain in the state of Connecticut.[1] Nonetheless, the flood from Hurricane Diane led to a significant death toll (nearly 200) from Pennsylvania eastward through southern New England.[25]

| 降雨量 | 风暴 | 地点 | 参 | ||
|---|---|---|---|---|---|
| 排名 | mm | ||||
| 1 | 434.3 | 17.10 | 1938 New England hurricane | Buck | [10] |
| 2 | 428.2 | 16.86 | Diane 1955 | Torrington #2 | Template:Tropical Cyclone Rainfall for New England |
| 3 | 338.3 | 13.32 | Eloise 1975 | Mount Carmel | [26] |
| 4 | 289.6 | 11.40 | Floyd 1999 | West Hartford | [26] |
| 5 | 257.8 | 10.15 | Irene 2011 | New Hartford | [27] |
| 6 | 240.8 | 9.48 | Connie 1955 | Round Pond | [26] |
| 7 | 185.9 | 7.34 | Donna 1960 | Wolcott Reservoir | [26] |
| 8 | 162.3 | 6.39 | Lee 2011 | Danbury | [28] |
| 9 | 158.0 | 6.22 | Bob 1991 | Norwich Public Utility Plant | [26] |
| 10 | 152.4 | 6.00 | Hurricane Seven, 1934 | [10] | |
Delaware 编辑
.jpg)
A large swath of heavy rainfall spread associated with a predecessor rainfall event fell before 1933 Chesapeake–Potomac hurricane arrived in Delaware. Over four days, a total of 13.24英寸(336毫米) of rain fell in Bridgeville, the most known associated with a tropical cyclone anywhere in Delaware.[10]
| 降雨量 | 风暴 | 地点 | 参 | ||
|---|---|---|---|---|---|
| 排名 | mm | ||||
| 1 | 278.9 | 10.98 | Sandy 2012 | Indian River Inlet | [29] |
| 2 | 268.7 | 10.58 | Floyd 1999 | Greenwood 2 NE | [29] |
| 3 | 264.9 | 10.43 | Irene 2011 | Ellendale | [27] |
| 4 | 207.8 | 8.18 | Connie 1955 | Newark University Farm | [29] |
| 5 | 195.6 | 7.70 | Donna 1960 | Bridgeville 1 NW | [29] |
| 6 | 193.0 | 7.60 | Agnes 1972 | Middletown 3 E | [29] |
| 7 | 181.1 | 7.13 | Danny 1985 | Lewes | [29] |
| 8 | 175.7 | 6.90 | 1933 Chesapeake–Potomac hurricane | Bridgeville | [29] |
| 9 | 174.5 | 6.87 | Allison 1989 | Wilmington New Castle | [29] |
| 10 | 158.0 | 6.22 | 1944 Great Atlantic hurricane | Millsboro | [29] |
Florida 编辑
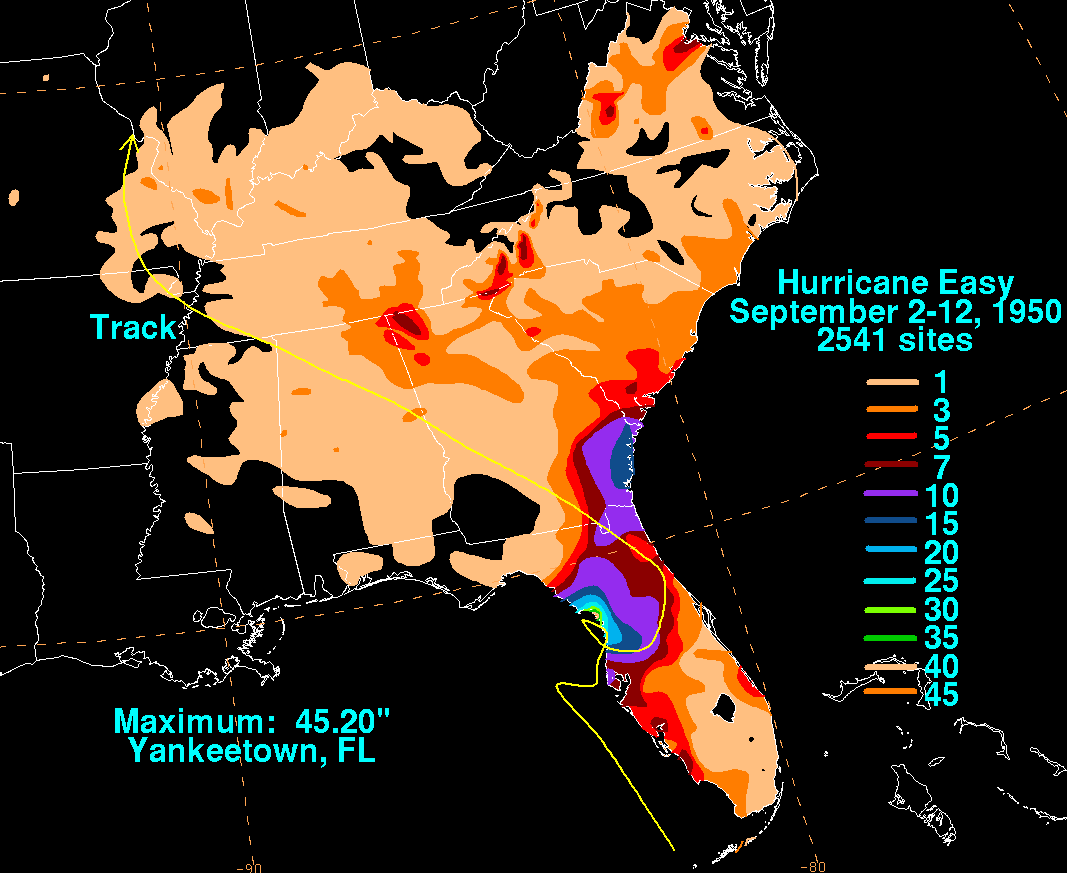
The heaviest rainfall to occur in 24 hours was measured in Yankeetown during Hurricane Easy in 1950, which caused 38.70英寸(983毫米) of precipitation. This is also the highest known point storm total maximum related to any tropical cyclone which has impacted Florida,[1] and by itself would be the highest known rainfall total for any month, or any 24 hour period, from any location within Florida. This rainfall amount remained the national 24-hour rainfall record until Tropical Storm Claudette's landfall in 1979.[30]

| 降雨量 | 风暴 | 地点 | 参 | ||
|---|---|---|---|---|---|
| 排名 | mm | ||||
| 1 | 1148.1 | 45.20 | Easy 1950 | Yankeetown | Template:Tropical Cyclone Rainfall in Florida |
| 2 | 976.9 | 38.46 | Georges 1998 | Munson | [31] |
| 3 | 889.0 | 35.00 | October Hurricane 1941 | Trenton | [32] |
| 4 | 731.0 | 28.78 | Debby 2012 | Curtis Mill | [31] |
| 5 | 702.3 | 27.65 | Fay 2008 | Melbourne/Windover Farms | [31] |
| 6 | 649.2 | 25.56 | Dennis 1981 | Homestead/Ira Ebersole | [31] |
| 7 | 635.0 | 25.00 | TD 1, 1992 | Arcadia Tower | [31] |
| 8 | 634.5 | 24.98 | Jeanne 1980 | Key West International Airport | [31] |
| 9 | 622.2 | 24.50 | July 1916 Hurricane | Bonifay | [10] |
| 10 | 602.7 | 23.73 | Dora 1964 | Mayo | [31] |
Georgia 编辑
Tropical Storm Alberto in 1994 looped across central Georgia, leading to 24-hour rainfall amounts exceeding 20英寸(510毫米) across central sections of the state.[33] It also became the wettest tropical cyclone on record for the state of Georgia, eclipsing the record set in 1929.[34]

| 降雨量 | 风暴 | 地点 | 参 | ||
|---|---|---|---|---|---|
| 排名 | mm | ||||
| 1 | 707.4 | 27.85 | Alberto 1994 | Americus | [33] |
| 2 | 621.3 | 24.46 | 1929 Florida Hurricane | Washington | [34] |
| 3 | 558.8 | 22.00 | T. D. #29 1969 | Attapulgus Mine | Template:Tropical Cyclone Rainfall in the Southeastern United States |
| 4 | 541.0 | 21.30 | Fay 2008 | Thomasville 5 WNW | [35] |
| 5 | 508.0 | 20.00 | 1929 Bahamas hurricane | Glenville | [10] |
| 6 | 505.2 | 19.89 | Marco 1990 | Louisville 1E | [1] |
| 7 | 444.0 | 17.48 | Matthew 2016 | Savannah Hunter Field | [36] |
| 8 | 412.5 | 16.24 | Easy 1950 | Savannah Hunter Field | [35] |
| 9 | 395.2 | 15.56 | Hanna 2002 | Donalsonville | [1] |
| 10 | 367.8 | 14.48 | Tammy 2005 | Darien | [1] |
Guam 编辑
Super Typhoon Pamela was not only a wet tropical cyclone for the island of Guam, but a destructive one as well. Since Pamela, wooden structures across Guam have been largely replaced by concrete structures in order to better weather typhoons.[37][38]
.JPG)
Hawaii 编辑

This island state frequently sees rainfall from the remains of former eastern and central Pacific tropical cyclones. However, despite Hawaii's location in the subtropics, direct impacts by tropical cyclones are infrequent due to the protective influence of the Central Pacific Tropical Upper Tropospheric Trough (TUTT), which normally dissipates systems approaching Hawaii. Hurricane Hiki in 1950 led to significant rainfall in the mountains, with 52英寸(1,300毫米) of rainfall reported.[3] This was the most rainfall reported to have been produced by a tropical cyclone within the United States until surpassed by Hurricane Harvey in 2017.[1] Template:Wettest tropical cyclones in Hawaii
Idaho 编辑
Impacts from tropical cyclones in the Pacific Northwest are rare. Most recently, the remains of Olivia moved through the region in 1982, spurring spotty moderate to heavy rainfall across Idaho.[22]

| 降雨量 | 风暴 | 地点 | 参 | ||
|---|---|---|---|---|---|
| 排名 | mm | ||||
| 1 | 52.1 | 2.051 | Kathleen 1976 | Ketchum RS | [22] |
| 2 | 50.5 | 1.988 | Olivia 1982 | Powell | [22] |
Illinois 编辑
Hurricane Audrey directed moisture up to a front to its north across the Midwest during late June 1957 as it transitioned into an extratropical cyclone. Heavy rains fell across central Illinois, leading to the wettest known event to be associated with a tropical cyclone or its remains across Illinois.[39]

| 降雨量 | 风暴 | 地点 | 参 | ||
|---|---|---|---|---|---|
| 排名 | mm | ||||
| 1 | 259.1 | 10.20 | Audrey 1957 | Paris | [29] |
| 2 | 207.8 | 8.18 | Carla 1961 | Mount Carroll | [29] |
| 3 | 108.5 | 7.64 | Claudette 1979 | Hutsonville Power Station | [29] |
| 4 | 192.5 | 7.58 | Paine 1986 | Avon 5 NE | [29] |
| 5 | 178.6 | 7.03 | Tico 1983 | New Athenas | [29] |
| 6 | 152.7 | 6.01 | Alberto 2018 | Glencoe 0.1 NW | [40] |
| 7 | 151.4 | 5.96 | Lester 1992 | Mattoon | [29] |
| 8 | 146.1 | 5.75 | Chantal 1989 | Fulton Dam 13 | [29] |
| 9 | 135.9 | 5.35 | Debra 1978 | Carbondale Sewage Plant | [29] |
| 10 | 130.6 | 5.14 | Bill 2015 | Cooks Mill | [41] |
Indiana 编辑
Similarly to Illinois, Indiana experienced its wettest tropical cyclone in 1957 with the arrival of Hurricane Audrey.[39] In 1979, Hurricane Bob produced considerable flooding in the state.[42]

| 降雨量 | 风暴 | 地点 | 参 | ||
|---|---|---|---|---|---|
| 排名 | mm | ||||
| 1 | 225.3 | 8.87 | Audrey 1957 | Rockville | [43] |
| 2 | 209.8 | 8.26 | Tico 1983 | Seymour 2 N | [43] |
| 3 | 174.2 | 6.86 | Isidore 2002 | Lexington 3 N | [43] |
| 4 | 170.7 | 6.72 | Bill 2015 | Grissom AFB | [44] |
| 5 | 162.6 | 6.40 | Cindy 2017 | Albany | [45] |
| 6 | 162.6 | 6.40 | Erin 1995 | North Vernon 1 NW | [43] |
| 7 | 146.6 | 5.77 | Claudette 1979 | Jasper | [43] |
| 8 | 145.3 | 5.72 | Bob 1979 | Edwardsport Power Plant | [43] |
| 9 | 131.1 | 5.16 | Katrina 2005 | Hanover Radio | [43] |
| 10 | 121.4 | 4.78 | Debra 1978 | Crane NSA | [43] |
Iowa 编辑
Hurricane Carla was a large hurricane that moved into Texas during September 1961. As it transitioned into an extratropical cyclone across the Great Plains and Midwest, heavy rain fell in a band on the poleward side of a frontal boundary extending northeast from Carla, leading to the wettest known event to be associated with a tropical cyclone or its remains across Iowa.[43]

| 降雨量 | 风暴 | 地点 | 参 | ||
|---|---|---|---|---|---|
| 排名 | mm | ||||
| 1 | 229.4 | 9.03 | Carla 1961 | Chariton 1 E | [43] |
| 2 | 124.5 | 4.90 | Frances 1998 | Fort Madison | [43] |
| 3 | 120.9 | 4.76 | Paine 1986 | Keokuk Lock Dam 19 | [43] |
| 4 | 99.8 | 3.93 | Waldo 1985 | Keosauqua | [43] |
| 5 | 94.0 | 3.70 | Newton 1986 | Mount Pleasant 1 SSW | [43] |
| 6 | 86.4 | 3.40 | Chantal 1989 | De Witt | [43] |
| 7 | 84.3 | 3.32 | Lester 1992 | Sigourney | [43] |
| 8 | 82.3 | 3.24 | Gustav 2008 | Rathbun Dam 2 N | [43] |
| 9 | 79.0 | 3.11 | Tico 1983 | Centerville | [43] |
| 10 | 60.7 | 2.39 | Juan 1985 | Bellevue Lock and Dam 12 | [43] |
Kansas 编辑
Heavy rainfall from Tropical Storm Frances fell from the western Gulf Coast northward into the Great Plains. Spreading across portions of Kansas, precipitation included with localized amounts above 12英寸(300毫米).[43]

| 降雨量 | 风暴 | 地点 | 参 | ||
|---|---|---|---|---|---|
| 排名 | mm | ||||
| 1 | 317.5 | 12.50 | Frances 1998 | Fort Scott | [43] |
| 2 | 288.3 | 11.35 | Paine 1986 | Fort Scott | [43] |
| 3 | 216.4 | 8.52 | Carla 1961 | Haddam | [43] |
| 4 | 170.4 | 6.71 | Tico 1983 | Independence | [43] |
| 5 | 147.1 | 5.79 | Newton 1986 | Tonganoxie 5 SE | [43] |
| 6 | 138.4 | 5.45 | Waldo 1985 | Burns | [43] |
| 7 | 127.0 | 5.00 | Gilbert 1988 | Cedar Vale | [43] |
| 8 | 117.6 | 4.63 | Norma 1981 | Iola 1 W | [43] |
| 9 | 114.6 | 4.51 | Matthew 2004 | Hale | [43] |
| 10 | 104.4 | 4.11 | Gustav 2008 | Pittsburg | [43] |
Kentucky 编辑
Soon after moving inland, the 1960 Texas tropical storm looped over South Texas, leading to heavy rains along the coastal plain near Port Lavaca. As it moved north-northeast, bursts of heavy rainfall were accompanied with the system over Arkansas and Kentucky. The maximum in Kentucky not only represents their highest tropical cyclone-related rainfall amount on record, but also the state's all-time 24 hour precipitation record (through 1998).[46]
.jpg)
| 降雨量 | 风暴 | 地点 | 参 | ||
|---|---|---|---|---|---|
| 排名 | mm | ||||
| 1 | 285.8 | 11.25 | Unnamed 1960 | Dunmor | [43] |
| 2 | 242.1 | 9.53 | Dennis 2005 | [47] | |
| 3 | 224.0 | 8.82 | Harvey 2017 | Brownsville Green River | [19] |
| 4 | 207.5 | 8.17 | Isidore 2002 | Paradise Steam Plant | [43] |
| 5 | 205.2 | 8.08 | Elena 1985 | WPSD-TV Paducah | [43] |
| 6 | 201.7 | 7.94 | Katrina 2005 | Finney | [43] |
| 7 | 195.8 | 7.71 | Tico 1983 | Lloyd Greenup Dam | [43] |
| 8 | 193.0 | 7.60 | Frederic 1979 | Aberdeen | [43] |
| 9 | 172.5 | 6.79 | Chris 1982 | Franklin 1 E | [43] |
| 10 | 170.4 | 6.71 | Jerry 1989 | Gray Hawk | [43] |
Louisiana 编辑
Heavy rains and flooding are the primary problem associated with tropical cyclones across the Pelican State. Recent examples of flooding across the state from tropical cyclones include Tropical Storm Allison in 2001, Tropical Storm Frances in 1998, Tropical Storm Allison in 1989, and Tropical Storm Claudette in 1979. Three of the four systems stalled across eastern Texas, prolonging the rainfall which occurred over Louisiana. If it were not for the intermittent invasions from tropical cyclones, rainfall during the months of August, September, and October would average about 25% less than it currently does.[48]

| 降雨量 | 风暴 | 地点 | 参 | ||
|---|---|---|---|---|---|
| 排名 | mm | ||||
| 1 | 952.2 | 37.50 | Unnamed 1940 | Miller Island | [10] |
| 2 | 760.0 | 29.92 | Allison 2001 | Thibodaux | [9] |
| 3 | 652.0 | 25.67 | Allison 1989 | Winnfield | [9] |
| 4 | 595.1 | 23.43 | Barry 2019 | Ragley | [49] |
| 5 | 568.7 | 22.39 | Frances 1998 | Terrytown | [9] |
| 6 | 565.4 | 22.25 | Harvey 2017 | Bayou Conway | [19] |
| 7 | 541.0 | 21.30 | Unnamed 1933 | Logansport | [10] |
| 8 | 533.4 | 21.00 | Gustav 2008 | Larto Lake | [9] |
| 9 | 524.8 | 20.66 | Isaac 2012 | New Orleans Carrollton | [11] |
| 10 | 497.8 | 19.60 | Tropical Storm Four 1908 | Franklin | [10] |
Maine 编辑
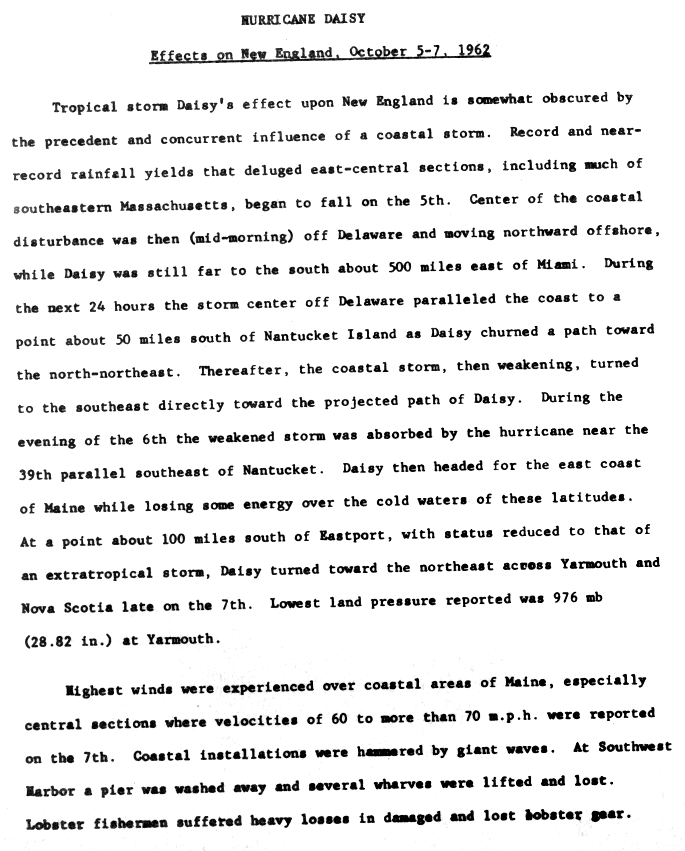
The combined impact from a Nor'easter just one day before Daisy hit, and Hurricane Daisy, caused severe flooding in Maine, when rain fell for 65 consecutive hours in some locations. Rainfall from the two systems caused record rainfall in some areas in Maine.[50][51] Flooding caused by Hurricane Irene's heavy rainfall washed out two bridges on State Route 27 in Carrabassett Valley.[52]

| 降雨量 | 风暴 | 地点 | 参 | ||
|---|---|---|---|---|---|
| 排名 | mm | ||||
| 1 | 251.7 | 9.91 | Irene 2011 | St. Baxter Park | [27] |
| 2 | 240.5 | 9.47 | Daisy 1962 | Portland Int'l Jetport | [26] |
| 3 | 221.5 | 8.72 | Floyd 1999 | Poland | [26] |
| 4 | 209.8 | 8.26 | Donna 1960 | Sanford 2 NNW | [26] |
| 5 | 209.3 | 8.24 | Bob 1991 | Portland Int'l Jetport | [26] |
| 6 | 193.9 | 7.61 | Hanna 2008 | Bar Harbour | [26] |
| 7 | 164.6 | 6.48 | Arthur 2014 | Whiting 3 NNE | [53] |
| 8 | 148.6 | 5.85 | Belle 1976 | Brunswick | [26] |
| 9 | 141.2 | 5.56 | Gerda 1969 | Saco | [26] |
| 10 | 133.4 | 5.25 | Bertha 1996 | West Rockport 1 NNW | [26] |
Maryland 编辑
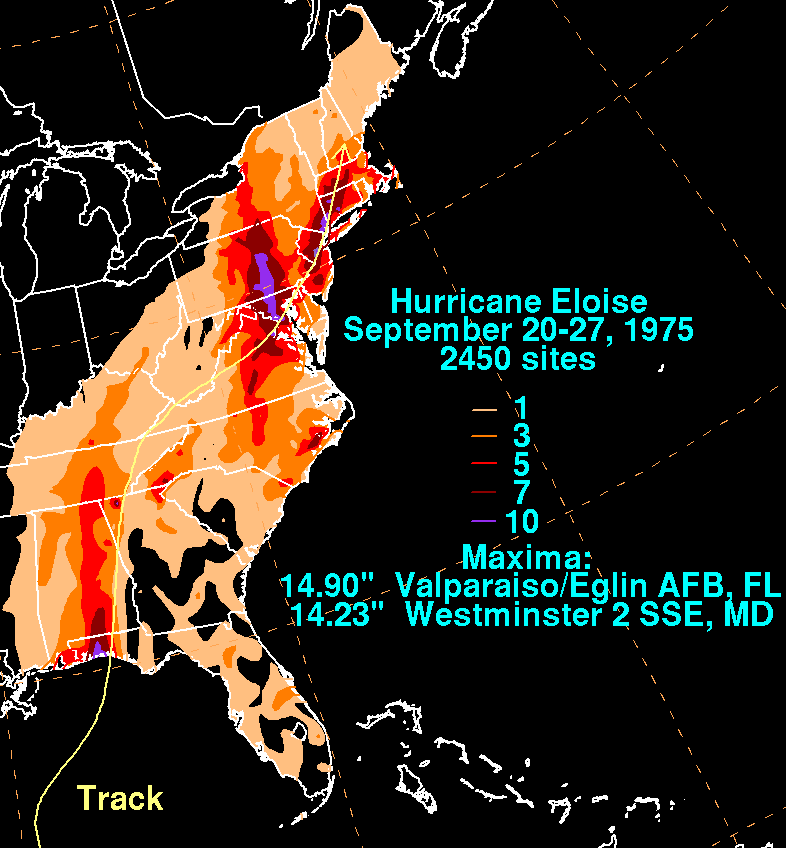
Eloise's remnants brought great moisture to the Northeast third of the United States in the combination of warm, tropical air and cold air from a cold front. From Virginia through New Jersey, 5英寸(130毫米) of rain were reported, while New York and Pennsylvania experienced 10英寸(250毫米). Westminster, Maryland received the maximum amount from the storm in this region with a total of 14.23英寸(361毫米).[54] The 1935 Labor Day hurricane holds the record for producing the most rainfall in Maryland.[10]

| 降雨量 | 风暴 | 地点 | 参 | ||
|---|---|---|---|---|---|
| 排名 | mm | ||||
| 1 | 424.2 | 16.70 | Labor Day 1935 hurricane | Easton | [10] |
| 2 | 361.4 | 14.23 | Eloise 1975 | Westminster 2 SSE | [54] |
| 3 | 346.2 | 13.63 | Lee 2011 | Waldorf 3.6 SSE | [28] |
| 4 | 344.4 | 13.56 | Agnes 1972 | Westminster 2 SSE | [29] |
| 5 | 337.8 | 13.30 | First August 1928 hurricane | Cheltenham | [10] |
| 6 | 329.2 | 12.96 | Irene 2011 | Plum Point | [27] |
| 7 | 318.8 | 12.83 | Sandy 2012 | Belleview | [1] |
| 8 | 319.8 | 12.59 | Floyd 1999 | Chestertown | [29] |
| 9 | 312.9 | 12.32 | Connie 1955 | Preston 1 S | [29] |
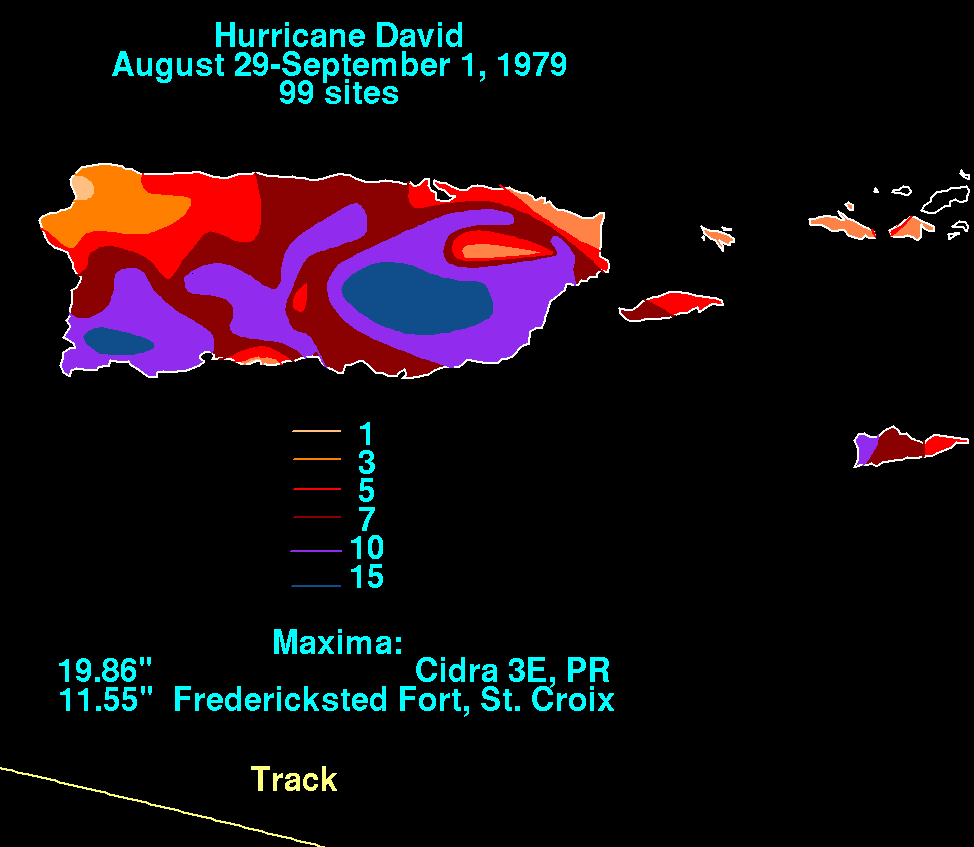
| 10 | 238.8 | 9.40 | David 1979 | Catoctin Mountain Park | [29] |
Massachusetts 编辑
The wettest known tropical cyclone to impact New England is also the wettest known for the state of Massachusetts.[1] The flood from Hurricane Diane led to a significant death toll (nearly 200) from Pennsylvania eastward through southern New England.[25]

| 降雨量 | 风暴 | 地点 | 参 | ||
|---|---|---|---|---|---|
| 排名 | mm | ||||
| 1 | 501.7 | 19.75 | Diane 1955 | Westfield | [10] |
| 2 | 324.4 | 12.77 | New England Hurricane of 1938 | Gardner | [1] |
| 3 | 317.5 | 12.50 | Carrie 1972 | Tashmoo | [26] |
| 4 | 312.4 | 12.3 | 1933 Outer Banks hurricane | Provincetown | [10] |
| 5 | 251.0 | 9.88 | Eloise 1975 | Westfield | [26] |
| 6 | 236.7 | 9.32 | Connie 1955 | Plainfield | [26] |
| 7 | 231.65 | 9.12 | Esther 1961 | Ashland | [26] |
| 8 | 231.1 | 9.10 | Irene 2011 | Savoy | [27] |
| 9 | 214.1 | 8.43 | Jeanne 2004 | Nantucket | [26] |
| 10 | 213.36 | 8.40 | Lee 2011 | Worthington | [55] |
Michigan 编辑
In 1961, Hurricane Carla generated more precipitation in Michigan than any other tropical cyclone has ever generated in the state. Carla is also the wettest tropical cyclone to have hit Iowa, Nebraska, and Wisconsin.[43]

| 降雨量 | 风暴 | 地点 | 参 | ||
|---|---|---|---|---|---|
| 排名 | mm | ||||
| 1 | 154.2 | 6.07 | Carla 1961 | Boyne Falls | [43] |
| 2 | 136.4 | 5.37 | Chantal 1989 | Kent City 2 SW | [43] |
| 3 | 127.5 | 5.02 | Newton 1986 | South Haven | [43] |
| 4 | 115.8 | 4.56 | Juan 1985 | Escanaba | [43] |
| 5 | 105.2 | 4.14 | Opal 1995 | Grosse Pointe Farms | [43] |
| 6 | 103.4 | 4.07 | Fran 1996 | Port Huron | [43] |
| 7 | 101.1 | 3.98 | Gustav 2008 | Sparta 2 SW | [43] |
| 8 | 90.7 | 3.57 | Alberto 2018 | Luzerne 2.4 NE | [40] |
| 9 | 85.9 | 3.38 | Frances 1998 | Kenton | [43] |
| 10 | 78.0 | 3.07 | Arlene 2005 | Hastings | [43] |
| 10 | 78.0 | 3.07 | Gilbert 1988 | Charlotte 3 S | [43] |
Minnesota 编辑
Few tropical cyclone remnants originating from the eastern Pacific or Atlantic Basins make it as far north as Minnesota. Most recently, 2004's Hurricane Javier dropped heavy rainfall exceeding 2英寸(51毫米) in localized spots.[43]

| 降雨量 | 风暴 | 地点 | 参 | ||
|---|---|---|---|---|---|
| 排名 | mm | ||||
| 1 | 97.3 | 3.83 | Lester 1992 | Indus 3 W | [43] |
| 2 | 52.8 | 2.08 | Javier 2004 | Bemidji Municipal AP | [43] |
| 3 | 41.9 | 1.65 | Alicia 1983 | Montgomery | [43] |
| 4 | 38.1 | 1.50 | Newton 1986 | Beaver | [43] |
Mississippi 编辑
Hurricane Georges stalled over the southern portion of the state, it produced torrential rainfall, exceeding 30英寸(760毫米) locally.[56] The heavy rainfall contributed to significant river overflowing, including the Tchoutacabouffa River at D'Iberville, which set a record crest of 19英尺(5.8米).[57]

| 降雨量 | 风暴 | 地点 | 参 | ||
|---|---|---|---|---|---|
| 排名 | mm | ||||
| 1 | 818.1 | 32.21 | Georges 1998 | Wiggins 5 W | Template:US States Tropical Cyclone Point Maxima |
| 2 | 678.4 | 26.71 | Isaac 2012 | Pascagoula | [1] |
| 3 | 535.0 | 21.06 | Unnamed 1987 | [1] | |
| 4 | 481.3 | 18.95 | Allison 2001 | Liberty 5 W | [9] |
| 5 | 364.0 | 14.33 | Gustav 2008 | Chatham | [9] |
| 6 | 344.2 | 13.55 | Lee 2011 | Waveland | [9] |
| 7 | 333.5 | 13.13 | Isidore 2002 | Poplarville Experimental Stn 5 W | [9] |
| 8 | 319.5 | 12.58 | Danny 1997 | Pascagoula 3 NE | [9] |
| 9 | 319.3 | 12.57 | Hilda 1964 | McComb Pike County AP | [9] |
| 10 | 312.4 | 12.30 | Cindy 2017 | Ocean Springs, 2 E | [58] |
Missouri 编辑
Remnant tropical cyclones can move into the state which originate in either the Pacific or Atlantic hurricane basins. Tropical Storm Erin reintensified over Oklahoma leading to heavy rainfall in that state. As the system moved eastward, its surface low quickly dissipated. However, its mid-level circulation remained robust, leading to a burst of heavy rainfall across Missouri exceeding 10英寸(250毫米) in isolated spots, which became the wettest tropical cyclone remnant on record for the state.[29][59]

| 降雨量 | 风暴 | 地点 | 参 | ||
|---|---|---|---|---|---|
| 排名 | mm | ||||
| 1 | 302.8 | 11.94 | Erin 2007 | Miller | [47] |
| 2 | 291.6 | 11.48 | Bertha 1957 | Kennett | [17] |
| 3 | 258.1 | 10.16 | Audrey 1957 | Hermann | [29] |
| 4 | 249.4 | 9.82 | Paine 1986 | Truman Dam & Reservoir | [29] |
| 5 | 237.2 | 9.34 | Carla 1961 | Condordia | [29] |
| 6 | 231.1 | 9.10 | Frances 1998 | Odessa 4 SE | [29] |
| 7 | 230.1 | 9.06 | Gustav 2008 | Alley Spring/Jack Fork | [29] |
| 8 | 209.6 | 8.25 | Bill 2015 | Fordland 4 WNW | [44] |
| 9 | 186.7 | 7.35 | Tico 1983 | Appleton City | [29] |
| 10 | 168.4 | 6.63 | Waldo 1985 | Polo | [29] |
Montana 编辑
It is rare for tropical cyclone remnants originating from the eastern Pacific or Atlantic Basins to make it as far north as Montana. The remains of Kathleen dropped locally heavy rainfall approaching 2英寸(51毫米) in localized spots.[22]

| 降雨量 | 风暴 | 地点 | 参 | ||
|---|---|---|---|---|---|
| 排名 | mm | ||||
| 1 | 48.0 | 1.89 | Kathleen 1976 | Lakeview | [22] |
Nebraska 编辑
The wettest known event in Nebraska to be associated with a tropical cyclone or its remains was Hurricane Carla. Carla resulted in the heaviest known rainfall in several other states as well.[43]
| 降雨量 | 风暴 | 地点 | 参 | ||
|---|---|---|---|---|---|
| 排名 | mm | ||||
| 1 | 144.3 | 5.68 | Carla 1961 | Hubbrell | [43] |
| 2 | 132.1 | 5.20 | Lester 1992 | Arnold | [43] |
| 3 | 69.3 | 2.73 | Alicia 1983 | Miller | [43] |
| 4 | 49.0 | 1.93 | Tico 1983 | Beemer | [43] |
| 5 | 46.7 | 1.84 | Javier 2004 | Ainsworth Municipal AP | [43] |
| 6 | 44.5 | 1.75 | Waldo 1985 | Falls City Brenner AP | [43] |
| 7 | 23.6 | 0.93 | Newton 1986 | Lyman | [43] |
Nevada 编辑
Every few years, Nevada is impacted by eastern Pacific tropical cyclones, or their remnants. The wettest known event for the state was during Hurricane Doreen, when over 4英寸(100毫米) fell in isolated spots.[22]

| 降雨量 | 风暴 | 地点 | 参 | ||
|---|---|---|---|---|---|
| 排名 | mm | ||||
| 1 | 105.2 | 4.14 | Doreen 1977 | Adaven | [22] |
| 2 | 89.4 | 3.52 | Olivia 1982 | Ely Yelland Field | [22] |
| 3 | 86.4 | 3.40 | Kathleen 1976 | Searchlight | [22] |
| 4 | 73.7 | 2.90 | Norman 1978 | Adaven | [22] |
| 5 | 50.8 | 2.00 | Boris 1990 | Lund | [22] |
| 6 | 36.1 | 1.42 | Nora 1997 | Valley of Fire State Park | [22] |
| 7 | 32.8 | 1.29 | Isis 1998 | Goldfield | [22] |
| 8 | 5.3 | 0.21 | Lester 1992 | Montello 2 SE | [22] |
New Hampshire 编辑
A large swath of heavy rainfall spread up the East Coast along a frontal zone draping over the northern side of Hurricane Floyd.[60] Nearly 10英寸(250毫米) fell across portions of New Hampshire, the most recorded during the passage of a tropical cyclone or its remnants.[26]

| 降雨量 | 风暴 | 地点 | 参 | ||
|---|---|---|---|---|---|
| 排名 | mm | ||||
| 1 | 242.3 | 9.54 | Floyd 1999 | Mount Washington | [26] |
| 2 | 189.7 | 7.47 | Bertha 1996 | Mount Washington | [26] |
| 3 | 189.5 | 7.46 | Bob 1991 | Mount Washington | [26] |
| 4 | 186.1 | 7.33 | Irene 2011 | Pinkham Notch | [27] |
| 5 | 184.2 | 7.25 | Donna 1960 | Macdowell Dam | [26] |
| 6 | 182.4 | 7.18 | Connie 1955 | Newport | [26] |
| 7 | 168.7 | 6.64 | Lee 2011 | Keene 1.7 WSW | [28] |
| 8 | 165.9 | 6.53 | Eloise 1975 | Greenville 2 NNE | [26] |
| 9 | 153.7 | 6.05 | Sandy 2012 | Randolph 1.4 NE | [61] |
| 10 | 153.2 | 6.03 | Gloria 1985 | Mount Washington | [26] |
New Jersey 编辑
A large swath of heavy rainfall spread up the East Coast along a frontal zone draping over the northern side of Hurricane Floyd.[60] Hurricane Four of the September 1940 hurricane season holds the record for the wettest tropical cyclone in New Jersey.[10]

| 降雨量 | 风暴 | 地点 | 参 | ||
|---|---|---|---|---|---|
| 排名 | mm | ||||
| 1 | 609.6 | 24.00 | September 1940 hurricane | Ewan | [10] |
| 2 | 452.1 | 17.80 | August 19, 1939 | Manahawkin, New Jersey | [10] |
| 3 | 358.9 | 14.13 | Floyd 1999 | Little Falls | [29][47] |
| 4 | 304.3 | 11.98 | 1944 Great Atlantic hurricane | New Brunswick Experimental Station | [1][29] |
| 5 | 302.5 | 11.91 | Sandy 2012 | Wildwood Crest 0.6 NNE | [61] |
| 6 | 291.6 | 11.48 | Connie 1955 | Canistear Reservoir | [29] |
| 7 | 286.3 | 11.27 | Irene 2011 | Freehold Township | [27] |
| 8 | 267.0 | 10.51 | Eloise 1975 | New Brunswick 3 SE | [29] |
| 9 | 261.4 | 10.29 | Doria 1971 | [1][29] | |
| 10 | 242.6 | 9.55 | Lee 2011 | Phillipsburg | [28] |
New Mexico 编辑
Tropical cyclones, and their remnants, move into New Mexico from both the eastern Pacific and Atlantic basins. Although Atlantic Basin tropical cyclones are more unusual events, the rainfall record for New Mexico was from a tropical depression which moved across Texas from the Gulf of Mexico in October 1954.[22]

| 降雨量 | 风暴 | 地点 | 参 | ||
|---|---|---|---|---|---|
| 排名 | mm | ||||
| 1 | 248.9 | 9.80 | Tropical Depression (10/1954) | Canton | [22] |
| 2 | 216.7 | 8.53 | Dolly 2008 | Sunspot | [22] |
| 3 | 169.2 | 6.66 | Waldo 1985 | Hobbs | [22] |
| 4 | 134.9 | 5.31 | Octave 1983 | Luna RS | [22] |
| 5 | 87.12 | 3.43 | Newton 2016 | Texico | [62] |
| 6 | 84.84 | 3.34 | TD Sixteen-E 2015 | Mogollon | [63] |
| 7 | 80.52 | 3.17 | Heather 1977 | Yeso 2 S | [22] |
| 8 | 75.95 | 2.99 | Raymond 1989 | Red River | [22] |
| 9 | 62.99 | 2.48 | Javier 2004 | Albuquerque | [22] |
| 10 | 55.12 | 2.17 | Lester 1992 | Lindrith 1 WSW | [22] |
New York 编辑
Tropical cyclones moving up the East Coast bring rainfall to New York frequently. During Hurricane Connie, over 13英寸(330毫米) fell in isolated spots, which was the most rainfall recorded with a tropical cyclone or its remains across the state.[27][29]
| 降雨量 | 风暴 | 地点 | 参 | ||
|---|---|---|---|---|---|
| 排名 | mm | ||||
| 1 | 386.1 | 15.20 | Connie 1955 | Slide Mountain | [10] |
| 2 | 337.8 | 13.30 | Irene 2011 | East Durham | [27] |
| 3 | 331.2 | 12.25 | Floyd 1999 | Yorktown Heights 1 W | [29] |
| 4 | 300.5 | 11.83 | Lee 2011 | Appalachian | [28] |
| 5 | 282.2 | 11.11 | 1944 Great Atlantic hurricane | Mineola | [29] |
| 6 | 280.9 | 11.06 | Eloise 1975 | Bedford Hills | [29] |
| 7 | 229.9 | 9.05 | Diane 1955 | Montauk | [29] |
| 8 | 222.8 | 8.77 | 1933 Chesapeake–Potomac hurricane | Honk Falls | [29] |
| 9 | 206.2 | 8.12 | Donna 1960 | Freeport | [29] |
| 10 | 204.2 | 8.04 | Gloria 1985 | Unadilla 2 N | [29] |
North Carolina 编辑

Heavy rains accompany tropical cyclones and their remnants which move northeast from the Gulf of Mexico coastline, as well as inland from the western subtropical Atlantic ocean. As much as 15% of the rainfall which occurs during the warm season in the Carolinas is attributable to tropical cyclones.[64] Over the past 30 years, the wettest tropical cyclone to strike the coastal plain was Hurricane Florence of September 2018, which dropped over 30英寸(760毫米) of rainfall in Swansboro. In the mountains, Hurricane Frances of September 2004 was the wettest, bringing over 23英寸(580毫米) of rainfall to Mount Mitchell.[35]
| 降雨量 | 风暴 | 地点 | 参 | ||
|---|---|---|---|---|---|
| 排名 | mm | ||||
| 1 | 912.6 | 35.93 | Florence 2018 | Elizabethtown | [7] |
| 2 | 611.1 | 24.06 | Floyd 1999 | Southport 5 N | [1] |
| 3 | 602.7 | 23.73 | Mid-July Hurricane 1916 | Altapass | [34] |
| 4 | 598.7 | 23.57 | Frances 2004 | Mount Mitchell | [1] |
| 5 | 524.5 | 20.65 | Mid-Aug Hurricane 1940 | Idlewild | [1] |
| 6 | 505.7 | 19.91 | Dennis 1999 | Ocracoke | [1] |
| 7 | 482.1 | 18.98 | Diana 1984 | Southport 5 N | [1] |
| 8 | 481.3 | 18.95 | Matthew 2016 | Evergreen | [36] |
| 9 | 444.5 | 17.50 | Ophelia 2005 | Oak Island Water Treatment Plant | [1] |
| 10 | 431.8 | 17.00 | Ivan 2004 | Cruso | [1] |
North Dakota 编辑
It is rare for tropical cyclone remnants originating from the eastern Pacific or Atlantic Basins to migrate as far north as North Dakota. The remains of Javier in 2004 dropped locally heavy rainfall exceeding 1英寸(25毫米) in localized spots.[43]
| 降雨量 | 风暴 | 地点 | 参 | ||
|---|---|---|---|---|---|
| 排名 | mm | ||||
| 1 | 34.0 | 1.34 | Javier 2004 | Homme Dam | [43] |
Northern Mariana Islands 编辑

The Northern Mariana Islands are an archipelago north of Guam which gets impacted by typhoons in the western Pacific from time to time. Typhoon Champi dropped 26.25英寸(667毫米) on Tinian in 2015,[65] making it the wettest known tropical cyclone for the island chain.
Template:Wettest tropical cyclones in the Northern Marianas Islands
Ohio 编辑
The state of Ohio can be impacted by the remnants of both eastern Pacific and Atlantic tropical cyclones, with a bulk of the activity originating in the Gulf of Mexico. Hurricane Frederic in 1979, interacting with a nearby frontal zone,[66] brought over 8英寸(200毫米) of rainfall to isolated spots of the state, becoming the wettest known tropical cyclone, or remnant, to impact Ohio.[43]

| 降雨量 | 风暴 | 地点 | 参 | ||
|---|---|---|---|---|---|
| 排名 | mm | ||||
| 1 | 220.2 | 8.67 | Frederic 1979 | Akron 30 E | [43] |
| 2 | 216.7 | 8.53 | Ivan 2004 | Albany | [43] |
| 3 | 201.9 | 7.95 | Frances 2004 | Mount Ephraim | [43] |
| 4 | 178.8 | 7.04 | Sandy 2012 | Kirtland 0.9 SW | [43] |
| 5 | 164.3 | 6.47 | Fran 1996 | Elyria 3 E | [43] |
| 6 | 157.0 | 6.18 | Katrina 2005 | Nashville | [43] |
| 7 | 156.2 | 6.15 | Tico 1983 | Ironton 1 NE | [43] |
| 8 | 138.7 | 5.46 | Isidore 2002 | New Carlisle | [43] |
| 9 | 129.8 | 5.11 | Bill 2015 | Lima Allen County Airport | [44] |
| 10 | 126.0 | 4.96 | Claudette 1979 | Newark Water Works | [43] |
Oklahoma 编辑
Remnant tropical cyclones can move into the state which originate in either the Pacific or Atlantic hurricane basins. In 2007, Tropical Storm Erin reintensified over Oklahoma leading to heavy rainfall within the state. Rainfall exceeded 12英寸(300毫米) in isolated spots, which turned out to be the third wettest tropical cyclone remnant on record for Oklahoma.[9][59]

| 降雨量 | 风暴 | 地点 | 参 | ||
|---|---|---|---|---|---|
| 排名 | mm | ||||
| 1 | 475.2 | 18.71 | Norma 1981 | Kingston 4 SSE | [1] |
| 2 | 430.5 | 16.95 | Tico 1983 | Just south of Chickasha | [9] |
| 3 | 325.4 | 12.81 | Erin 2007 | Eakly 3 NE | [9] |
| 4 | 318.3 | 12.53 | Bill 2015 | Healdton 3 E | [44] |
| 5 | 306.6 | 12.07 | Dean 1995 | Great Salt Plains Dam | [9] |
| 6 | 279.9 | 11.02 | Frances 1998 | Valliant 3 W | [9] |
| 7 | 275.3 | 10.84 | Paine 1986 | Ponca City Municipal AP | [9] |
| 8 | 218.4 | 8.60 | Gilbert 1988 | Wichita Mountain Wildlife Refuge | [9] |
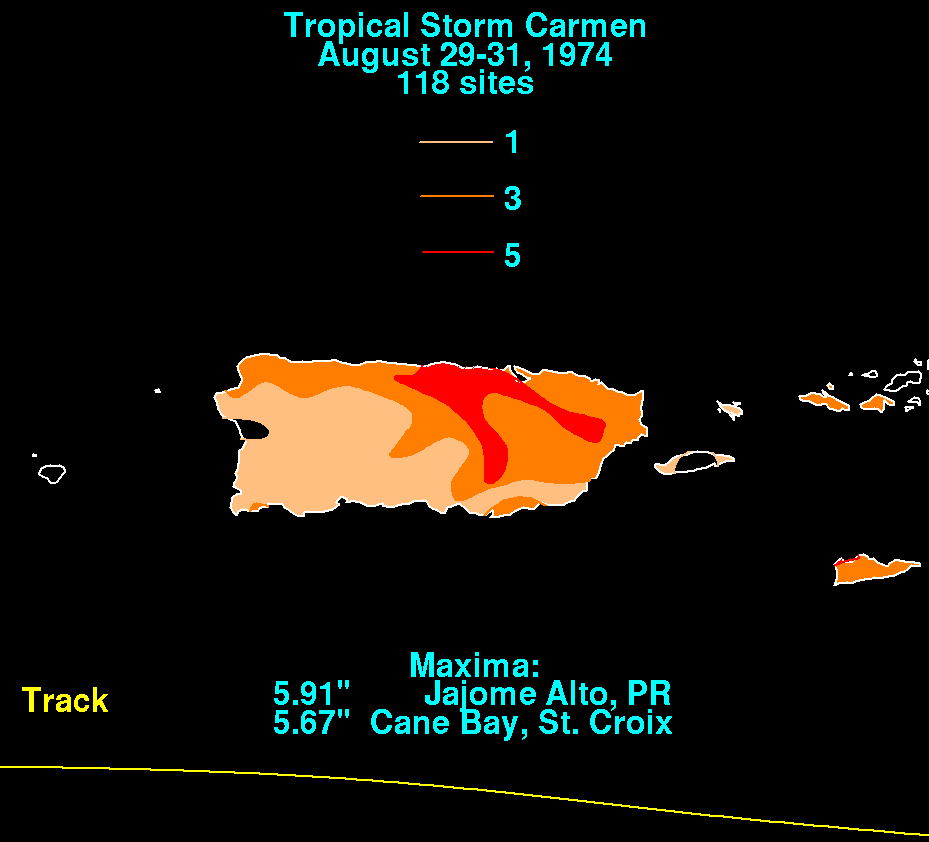
| 9 | 217.7 | 8.57 | Carmen 1974 | Flashman Tower | [9] |
| 10 | 208.8 | 8.22 | Delia 1973 | Hobart Municipal AP | [9] |
Oregon 编辑
Impacts from tropical cyclones in the Pacific Northwest are rare.[22] Most recently, the remains of Ignacio moved through the region, spurring spotty moderate rainfall across the region.[67]
.JPG)
| 降雨量 | 风暴 | 地点 | 参 | ||
|---|---|---|---|---|---|
| 排名 | mm | ||||
| 1 | 34.3 | 1.35 | Kathleen 1976 | Rome 2 NW | [22] |
| 2 | 32.0 | 1.26 | Ignacio 1997 | Crater Lake NPS HQ | [22] |
Pennsylvania 编辑
Although Hurricane Agnes was barely a hurricane at landfall in Florida, its major impact was over the Mid-Atlantic region, where Agnes combined with a non-tropical low to produce widespread rains of 6至12英寸(150至300毫米) with local amounts up to 19英寸(480毫米) in western Schuylkill County in Pennsylvania.[1] These rains produced widespread severe flooding from Virginia northward to New York, with other flooding occurring over the western portions of the Carolinas.

Puerto Rico 编辑
Puerto Rico has seen dramatic rainfall from tropical cyclones and their precursor disturbances. The most recent tropical cyclone-related deluge was from Hurricane Irene in August 2011, when 22.05英寸(560毫米) of rain was measured at Gurabo Abajo.[68] The heaviest rainfall noted over the past 30 years was from the precursor disturbance to Tropical Storm Isabel, when 31.67英寸(804毫米) fell at Toro Negro Forest.[69] Hurricane Eloise of 1975 dropped 33.29英寸(846毫米) of rainfall at Dos Bocas, with 23.07英寸(586毫米) falling in 24 hours.

Rhode Island 编辑
The flood from Hurricane Diane led to a significant death toll (nearly 200) from Pennsylvania eastward through southern New England.[25]
.jpg)
| 降雨量 | 风暴 | 地点 | 参 | ||
|---|---|---|---|---|---|
| 排名 | mm | ||||
| 1 | 309.9 | 12.2 | Unnamed 1932 | Westerly | [10] |
| 2 | 214.6 | 8.45 | Diane 1955 | Greenville | [26] |
| 3 | 181.1 | 7.13 | Bob 1991 | North Foster | [26] |
| 4 | 175.3 | 6.90 | Unnamed 1924 | Kingston | [10] |
| 5 | 149.9 | 5.90 | Floyd 1999 | North Foster 1 E | [26] |
| 6 | 145.8 | 5.74 | Connie 1955 | Kingston | [26] |
| 7 | 137.2 | 5.40 | Lee 2011 | Coventry Center | [28] |
| 8 | 136.4 | 5.37 | Irene 2011 | Warren | [27] |
| 9 | 133.4 | 5.25 | Allison 2001 | North Foster | [26] |
| 10 | 126.2 | 4.97 | Eloise 1975 | North Foster 1 E | [26] |
South Carolina 编辑
Portions of South Carolina experienced significant rainfall totals eclipsing 35英寸(890毫米) with Hurricane Florence, which became the wettest known tropical cyclone to impact the state. The flash flooding covered numerous roadways and washed out bridges. River flooding was great across the state. In addition, the rainfall broke dams, flooded houses, and covered fields.
| 降雨量 | 风暴 | 地点 | 参 | ||
|---|---|---|---|---|---|
| 排名 | mm | ||||
| 1 | 600.2 | 23.63 | Florence 2018 | Loris | [70] |
| 2 | 470.2 | 18.51 | Jerry 1995 | Antreville | [1] |
| 3 | 443.2 | 17.45 | Beryl 1994 | Jocassee 8 WNW | [1] |
| 4 | 429.3 | 16.90 | Matthew 2016 | Edisto Island | [36] |
| 4 | 407.9 | 16.06 | Floyd 1999 | Myrtle Beach Airport | [71] |
| 6 | 358.4 | 14.11 | T. D. #8 1971 | Sullivans Island | [1] |
| 7 | 354.6 | 13.96 | Marco/Klaus 1990 | Pageland | [35] |
| 8 | 342.1 | 13.47 | Mid-Aug T.S. 1928 | Caesars Head | [34] |
| 9 | 321.6 | 12.66 | Southeast hurricane (1940) | Charleston | [35] |
| 10 | 318.3 | 12.53 | Okeechobee 1928 | Darlington | [34] |
South Dakota 编辑
It is rare for tropical cyclone remnants originating from the eastern Pacific or Atlantic Basins to move as far inland as South Dakota. The remains of Javier in 2004 dropped locally heavy rainfall exceeding 2英寸(51毫米) in localized spots.[43]
| 降雨量 | 风暴 | 地点 | 参 | ||
|---|---|---|---|---|---|
| 排名 | mm | ||||
| 1 | 83.6 | 3.29 | Lester 1992 | Armour | [43] |
| 2 | 71.9 | 2.83 | Javier 2004 | Gregory | [43] |
Tennessee 编辑
Tropical Storm Chris moved inland into the Southeast, producing a burst of rainfall across Tennessee exceeding 13英寸(330毫米).[72] This system stands as Tennessee's wettest known tropical cyclone.[35]

| 降雨量 | 风暴 | 地点 | 参 | ||
|---|---|---|---|---|---|
| 排名 | mm | ||||
| 1 | 345.4 | 13.60 | Chris 1982 | Milan | [35] |
| 2 | 332.9 | 13.11 | Lee 2011 | Charleston | [55] |
| 3 | 285.8 | 11.25 | Ivan 2004 | Soddy Daisy Mowbray Mt | [35] |
| 4 | 267.2 | 10.52 | Isidore 2002 | Big Sandy | [35] |
| 5 | 232.9 | 9.17 | Harvey 2017 | Port Royal | [19] |
| 6 | 213.1 | 8.39 | Allison 1989 | Murfreesboro 5 N | [35] |
| 7 | 185.7 | 7.31 | Gracie 1959 | Roan High Knob | [35] |
| 8 | 183.6 | 7.23 | Easy 1950 | Point Park Lookout Mountain | [35] |
| 9 | 172.2 | 6.78 | Dennis 2005 | Oak Ridge ATDD | [35] |
| 10 | 168.1 | 6.62 | Babe 1977 | Chattanooga Lovell Field | [35] |
Texas 编辑

The most serious threat from tropical cyclones in Texas residents is from flooding, from both Gulf of Mexico hurricanes and tropical storms and the remnants of Eastern Pacific storms. Systems with sprawling circulations, such as Hurricane Beulah, also tend to make good rainmakers.[73] Slow moving systems, such as Tropical Storm Amelia or Hurricane Harvey also can produce significant rainfall over Texas. Harvey's storm total rainfall is the most recorded within the United States.[74][75] Harvey's extremely heavy rainfall produced catastrophic flooding across much of southeastern Texas; particularly in and around the Houston metropolitan area, where accumulations exceeded 40英寸(1,000 mm) over a four-day period.[74] Tropical Storm Claudette holds the national 24-hour rainfall record for the United States, with 42英寸(1,100毫米) falling within a day.[76]
| 降雨量 | 风暴 | 地点 | 参 | ||
|---|---|---|---|---|---|
| 排名 | mm | ||||
| 1 | 1538.7 | 60.58 | Harvey 2017 | Nederland | [1] |
| 2 | 1219.2 | 48.00 | Amelia 1978 | Medina | [1] |
| 3 | 1143.0 | 45.00 | Claudette 1979 | Alvin coop site | [76] |
| 4 | 1102 | 43.39 | Imelda 2019 | North Fork Taylor Bayou | [77] |
| 5 | 1033.3 | 40.68 | Allison 2001 | Moore Road Detention Pond | [1] |
| 6 | 1008.6 | 39.71 | September Hurricane 1921 | Thrall | [10] |
| 7 | 762.0 | 30.00 | September T.S. 1936 | Broome | [10] |
| 8 | 755.9 | 29.76 | Unnamed 1960 | Port Lavaca #2 | [1] |
| 9 | 695.5 | 27.38 | Beulah 1967 | Pettus | [1] |
| 10 | 688.3 | 27.10 | Alice 1954 | Pandale | [10] |
United States Virgin Islands 编辑

Tropical cyclones affect these islands of the northeast Caribbean on a regular basis. Hurricane Hortense is the wettest known system for the U. S. Virgin Islands, bringing over 18英寸(460毫米) of rainfall.[78]
| 降雨量 | 风暴 | 地点 | 参 | ||
|---|---|---|---|---|---|
| 排名 | mm | ||||
| 1 | 458.0 | 18.03 | Hortense 1996 | Christiansted Hamilton Field | [78] |
| 2 | 394.5 | 15.53 | Klaus 1984 | Caneel Bay Plantation | [1] |
| 3 | 293.4 | 11.55 | David 1979 | Fredericksted Fort | [79] |
| 4 | 284.5 | 11.20 | Hugo 1989 | Ham Bluff Light House Station | [1] |
| 5 | 265.9 | 10.47 | Lenny 1999 | Granard | [1] |
| 6 | 234.2 | 9.22 | Eloise 1975 | Annaly | [1] |
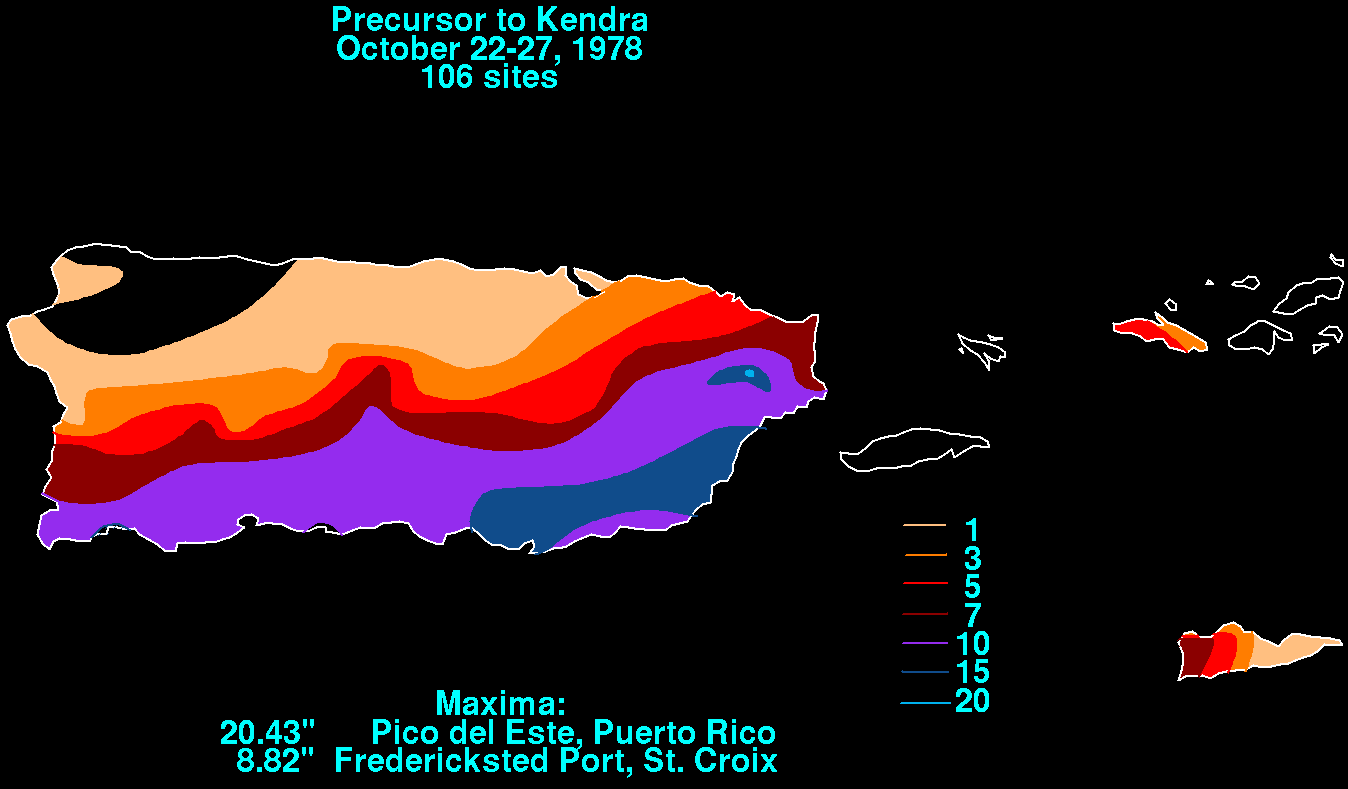
| 7 | 224.0 | 8.82 | Kendra 1978 | Fredericksted Fort | [80] |
| 8 | 221.2 | 8.71 | Isabel 1985 | Annually | [1] |
| 9 | 154.4 | 6.05 | Grace 1997 | Wintberg | [1] |
| 10 | 144.0 | 5.67 | Carmen 1974 | Cane Bay | [81] |
Utah 编辑
On occasion, Utah is impacted by the remnants of eastern Pacific tropical cyclones. The remains of Olivia moved through the region in 1982, spurring spotty moderate to heavy rainfall exceeding 7英寸(180毫米) in isolated spots.[22]
| 降雨量 | 风暴 | 地点 | 参 | ||
|---|---|---|---|---|---|
| 排名 | mm | ||||
| 1 | 188.2 | 7.41 | Olivia 1982 | Cottonwood Weir | [22] |
| 2 | 109.5 | 4.31 | Doreen 1977 | Logan 5 SW Experimental Farm | [22] |
| 3 | 61.7 | 2.43 | Javier 2004 | Monticello 15 ESE | [22] |
| 4 | 59.4 | 2.34 | Boris 1990 | Bartholomew Powerhouse | [22] |
| 5 | 56.1 | 2.21 | Nora 1997 | Enterprise | [22] |
| 6 | 48.0 | 1.89 | Lester 1992 | Cedar City and New Harmony | [22] |
| 7 | 38.6 | 1.52 | Isis 1998 | La Verkin | [22] |
| 8 | 33.8 | 1.33 | Kathleen 1976 | New Harmony | [22] |
Vermont 编辑
A large swath over heavy rainfall spread up the East Coast along a frontal zone draped over the northern side of Hurricane Floyd.[60] Over 11英寸(280毫米) fell across portions of Vermont, the most recorded during the passage of a tropical cyclone or its remnants within the state.[26]

| 降雨量 | 风暴 | 地点 | 参 | ||
|---|---|---|---|---|---|
| 排名 | mm | ||||
| 1 | 292.9 | 11.53 | Floyd 1999 | Mount Mansfield | [26] |
| 2 | 285.2 | 11.23 | Irene 2011 | Mendon | [27] |
| 3 | 209.8 | 8.26 | Connie 1955 | Whitingham 1 W | [26] |
| 4 | 170.2 | 6.70 | Erin 1995 | Morrisville Stowe State Park | [26] |
| 5 | 167.9 | 6.61 | Lee 2011 | Pownal | [28] |
| 6 | 160.8 | 6.33 | Donna 1960 | Somerset | [26] |
| 7 | 145.5 | 5.73 | Bertha 1996 | Dorset 2 SE | [26] |
| 8 | 126.5 | 4.98 | Chris 1988 | Vernon | [26] |
| 9 | 124.7 | 4.91 | Eloise 1975 | Vernon | [26] |
| 10 | 113.7 | 4.48 | Able 1950 | Searsburg Power Plant | [26] |
Virginia 编辑
Virginia has some special considerations that affect tropical cyclone-related rainfall. Mountains to the west act as a perfect mechanism for upward motion during sustained east winds, which can lead to flash flooding and landslides in that region (e.g. Hurricane Camille). As a tropical system approaches from the south, a frontal zone sets up between the moist Atlantic Ocean and the drier landmass to the west. This boundary can set up two or three days in advance of a tropical storm, and can lead up to prolonged heavy rains across coastal sections (e.g. Hurricane Floyd). As the cyclone advances north, the boundary will slowly shift west, but progresses west of a Richmond/Washington, D.C. line.[82]

| 降雨量 | 风暴 | 地点 | 参 | ||
|---|---|---|---|---|---|
| 排名 | mm | ||||
| 1 | 685.8 | 27.00 | Camille 1969 | West-Central Nelson County | [29] |
| 2 | 532.4 | 20.96 | Lee 2011 | Colonial Beach | [55] |
| 3 | 513.1 | 20.20 | Isabel 2003 | Upper Sherando | [1] |
| 4 | 480.1 | 18.9 | October 1942 T.S. | Big Meadows | [10] |
| 5 | 457.2 | 18.0 | Ida 2009 | Hampton 1.8 NW | [29] |
| 6 | 444.5 | 17.50 | Southeast hurricane 1940 | Keysville | [10] |
| 7 | 431.3 | 16.98 | Floyd 1999 | Williamsburg 2 N | [29] |
| 8 | 406.4 | 16.00 | Fran 1996 | Big Meadows | [1] |
| 9 | 364.0 | 14.33 | Cleo 1964 | Back Bay Wildlife Refuge | [1] |
| 10 | 360.9 | 14.21 | Matthew 2016 | Chesapeake | [36] |
Washington 编辑
Impacts from tropical cyclones in the Pacific Northwest are rare.[22] The remains of Ignacio moved through the region, spurring spotty moderate rainfall across the region.[67]
| 降雨量 | 风暴 | 地点 | 参 | ||
|---|---|---|---|---|---|
| 排名 | mm | ||||
| 1 | 18.3 | 0.72 | Ignacio 1997 | Merwin Dam | [22] |
West Virginia 编辑
Although Hurricane Agnes was barely a hurricane at landfall in Florida, its major impact was over the Mid-Atlantic region, where Agnes combined with a non-tropical low to produce widespread heavy rainfall, including amounts approaching 8英寸(200毫米) in isolated spots of West Virginia.[29] These rains produced widespread severe flooding from Virginia northward to New York, with other flooding occurring over the western portions of the Carolinas.

| 降雨量 | 风暴 | 地点 | 参 | ||
|---|---|---|---|---|---|
| 排名 | mm | ||||
| 1 | 201.7 | 7.94 | Agnes 1972 | Berkeley Springs | [29] |
| 2 | 180.0 | 7.09 | Lee 2011 | Mt. Storm | [55] |
| 3 | 175.3 | 6.90 | Hazel 1954 | Mathias | [29] |
| 4 | 174.5 | 6.87 | Eloise 1975 | Brushy Run | [29] |
| 5 | 152.9 | 6.02 | Frances 2004 | Berkeley Springs | [29] |
| 6 | 141.5 | 5.57 | Gracie 1959 | Wardensville RM Farm | [29] |
| 7 | 136.1 | 5.36 | Connie 1955 | Kearneysville | [29] |
| 8 | 128.0 | 5.04 | Camille 1969 | McRoss | [29] |
| 9 | 118.9 | 4.68 | Beryl 1994 | Richwood 1 SSE | [29] |
| 10 | 114.0 | 4.49 | Donna 1960 | Thomas | [29] |
Wisconsin 编辑
Wisconsin experienced its heaviest tropical-cyclone-related rainfall in 1961 when Hurricane Carla entered the United States. Carla broke the record for highest rainfall in three other states as well.[43]

| 降雨量 | 风暴 | 地点 | 参 | ||
|---|---|---|---|---|---|
| 排名 | mm | ||||
| 1 | 192.5 | 7.58 | Carla 1961 | Brodhead | [43] |
| 2 | 124.5 | 4.90 | Juan 1985 | Marinette | [43] |
| 3 | 95.3 | 3.75 | Frances 1998 | Darlington | [43] |
| 4 | 93.2 | 3.67 | Chantal 1989 | Port Washington | [43] |
| 5 | 83.8 | 3.30 | Newton 1986 | Beloit | [43] |
| 6 | 79.8 | 3.14 | Gustav 2008 | Kenosha | [43] |
| 7 | 71.9 | 2.83 | Lester 1992 | Blue Mounds 6 SSE | [43] |
| 8 | 71.9 | 2.83 | Unnamed 1960 | Eau Pleine Reservoir | [43] |
| 9 | 68.1 | 2.68 | Alberto 2018 | New London 1 ENE | [40] |
| 10 | 65.3 | 2.57 | Alicia 1983 | Green Bay International Airport | [43] |
Wyoming 编辑
Few tropical cyclone remnants originating from the eastern Pacific make it as far north as Wyoming. Most recently, Hurricane Javier dropped locally heavy rainfall of up to 2英寸(51毫米) in the higher terrain of western Wyoming.[22]
| 降雨量 | 风暴 | 地点 | 参 | ||
|---|---|---|---|---|---|
| 排名 | mm | ||||
| 1 | 50.80 | 2.00 | Javier 2004 | Encampment 19 WNW | Template:Tropical Cyclone Rainfall for the Western United States |
| 2 | 25.90 | 1.02 | Boris 1990 | Bitter Creek 4 NE | [22] |
See also 编辑
References 编辑
- ^ 1.00 1.01 1.02 1.03 1.04 1.05 1.06 1.07 1.08 1.09 1.10 1.11 1.12 1.13 1.14 1.15 1.16 1.17 1.18 1.19 1.20 1.21 1.22 1.23 1.24 1.25 1.26 1.27 1.28 1.29 1.30 1.31 1.32 1.33 1.34 1.35 1.36 1.37 1.38 1.39 1.40 1.41 1.42 1.43 1.44 1.45 1.46 1.47 1.48 1.49 1.50 1.51 1.52 1.53 1.54 1.55 1.56 1.57 1.58 引证错误:没有为名为
WPCMAX的参考文献提供内容 - ^ David Roth. Hurricane Lane - August 22-27, 2018. Weather Prediction Center. 2019 [July 24, 2019].
- ^ 3.0 3.1 Central Pacific Hurricane Center. Tropical Cyclones During the Years 1900-1952 (报告). United States National Oceanic and Atmospheric Administration's National Weather Service. [January 26, 2007].
- ^ Meg Wagner, Paul P. Murphy, Mike Hayes and Fernando Alfonso III. Serious flooding in Texas. cnn.com. CNN. September 19, 2019 [September 19, 2019].
- ^ Roth, David M.; Hydrometeorological Prediction Center. Remains of Paul (GIF). Tropical Cyclone Point Maxima. United States National Oceanic and Atmospheric Administration's National Weather Service. [December 28, 2007].
- ^ Meg Wagner, Paul P. Murphy, Mike Hayes and Fernando Alfonso III. Serious flooding in Texas. cnn.com. CNN. September 19, 2019 [September 19, 2019].
- ^ 7.0 7.1 Connor Pregizer. Major preliminary rainfall totals for Hurricane Florence. KTVQ Billings News. September 20, 2018 [September 23, 2018].
- ^ Roth, David M; Hydrometeorological Prediction Center. Hurricane Danny Rainfall Page. Tropical Cyclone Point Maxima. United States National Oceanic and Atmospheric Administration's National Weather Service. [June 9, 2012].
- ^ 9.00 9.01 9.02 9.03 9.04 9.05 9.06 9.07 9.08 9.09 9.10 9.11 9.12 9.13 9.14 9.15 9.16 9.17 9.18 9.19 9.20 9.21 9.22 9.23 9.24 9.25 Roth, David M; Hydrometeorological Prediction Center. Tropical Cyclone Rainfall Impacts along the Gulf Coast. Tropical Cyclone Point Maxima. United States National Oceanic and Atmospheric Administration's National Weather Service. [June 4, 2012].
- ^ 10.00 10.01 10.02 10.03 10.04 10.05 10.06 10.07 10.08 10.09 10.10 10.11 10.12 10.13 10.14 10.15 10.16 10.17 10.18 10.19 10.20 10.21 10.22 10.23 10.24 10.25 10.26 Schoner, Robert W; Molansky, Sydney; National Hurricane Research Project. Rainfall associated with Hurricanes and other Tropical Disturbances (PDF) (报告). United States National Oceanic and Atmospheric Administration's National Weather Service. 1956 [June 14, 2012].
- ^ 11.0 11.1 11.2 Gerhardt; National Hurricane Center. Tropical Cyclone Report: Hurricane Isaac. United States National Oceanic and Atmospheric Administration's National Weather Service. January 28, 2013 [March 27, 2013].
- ^ Central Pacific Hurricane Center. The 1978 Central Pacific Tropical Cyclone Season (报告). United States National Oceanic and Atmospheric Administration's National Weather Service. [June 5, 2012].
- ^ Astrid Sesega. Cyclone Fears High In Samoa. [March 7, 2008].
- ^ Rappaport, Edward N; National Hurricane Center. Hurricane Nora 1997 (Preliminary Report). United States National Oceanic and Atmospheric Administration's National Weather Service. [March 4, 2008]. (原始内容存档于September 25, 2005).
- ^ ...Top Arizona Hurricane/Tropical Storm Events... [December 30, 2007].
- ^ 16.0 16.1 Barry Sets New Rainfall Record in Arkansas. Little Rock, Arkansas: KARK-TV. July 16, 2019 [July 17, 2019].
- ^ 17.0 17.1 Roth, David M; Hydrometeorological Prediction Center. Tropical Storm Bertha (1957) Rainfall Graphic. Tropical Cyclone Point Maxima. United States National Oceanic and Atmospheric Administration's National Weather Service. March 8, 2010 [March 8, 2010].
- ^ Peterson, Dan; Hydrometeorological Prediction Center. Public Advisory Number 44 for Tropical Depression Gustav. United States National Oceanic and Atmospheric Administration's National Weather Service. [June 4, 2012].
- ^ 19.0 19.1 19.2 19.3 Tate. Post-Tropical Cyclone Harvey Advisory Number 53. [September 3, 2017].
- ^ Chenoweth, Michael; Landsea, Christopher W. The San Diego Hurricane of October 2, 1858. Bulletin of the American Meteorological Society (American Meteorological Society). 2004, 85 (11): 1689. Bibcode:2004BAMS...85.1689C. doi:10.1175/BAMS-85-11-1689.
- ^ Roth, David M; Hydrometeorological Prediction Center. Hurricane Kathleen Rainfall Page. Tropical Cyclone Point Maxima. United States National Oceanic and Atmospheric Administration's National Weather Service. March 8, 2010 [June 4, 2012].
- ^ 22.00 22.01 22.02 22.03 22.04 22.05 22.06 22.07 22.08 22.09 22.10 22.11 22.12 22.13 22.14 22.15 22.16 22.17 22.18 22.19 22.20 22.21 22.22 22.23 22.24 22.25 22.26 22.27 22.28 22.29 22.30 22.31 22.32 22.33 22.34 22.35 22.36 22.37 22.38 22.39 22.40 22.41 22.42 22.43 22.44 22.45 22.46 22.47 22.48 22.49 22.50 引证错误:没有为名为
Western的参考文献提供内容 - ^ Weather Forecast Office San Diego, California. A History of Significant Weather Events in Southern California (PDF) (报告). United States National Oceanic and Atmospheric Administration's National Weather Service: 11. [June 4, 2012]. (原始内容存档 (PDF)于June 4, 2012).
- ^ Daniel P. Brown. Hurricane Linda (EP152015) (PDF) (报告). Tropical Cyclone Report. National Hurricane Center. November 12, 2015 [October 13, 2019].
- ^ 25.0 25.1 25.2 Roth, David M; Hydrometeorological Prediction Center. Hurricane Diane Rainfall Page. Tropical Cyclone Point Maxima. United States National Oceanic and Atmospheric Administration's National Weather Service. March 4, 2008 [March 4, 2008].
- ^ 26.00 26.01 26.02 26.03 26.04 26.05 26.06 26.07 26.08 26.09 26.10 26.11 26.12 26.13 26.14 26.15 26.16 26.17 26.18 26.19 26.20 26.21 26.22 26.23 26.24 26.25 26.26 26.27 26.28 26.29 26.30 26.31 26.32 26.33 26.34 26.35 26.36 26.37 26.38 26.39 26.40 引证错误:没有为名为
New Eng的参考文献提供内容 - ^ 27.00 27.01 27.02 27.03 27.04 27.05 27.06 27.07 27.08 27.09 27.10 Soltow, Michael C. Post-Tropical Cyclone Irene Public Advisory Thirty-Seven (Final). Hydrometeorological Prediction Center. August 29, 2011 [August 29, 2011].
- ^ 28.0 28.1 28.2 28.3 28.4 28.5 28.6 引证错误:没有为名为
lee2011的参考文献提供内容 - ^ 29.00 29.01 29.02 29.03 29.04 29.05 29.06 29.07 29.08 29.09 29.10 29.11 29.12 29.13 29.14 29.15 29.16 29.17 29.18 29.19 29.20 29.21 29.22 29.23 29.24 29.25 29.26 29.27 29.28 29.29 29.30 29.31 29.32 29.33 29.34 29.35 29.36 29.37 29.38 29.39 29.40 29.41 29.42 29.43 29.44 29.45 29.46 29.47 29.48 29.49 29.50 29.51 29.52 29.53 29.54 引证错误:没有为名为
Mid Atl的参考文献提供内容 - ^ Roth, David M; Hydrometeorological Prediction Center. Hurricane Easy (1950) Rainfall Graphic (GIF). Tropical Cyclone Point Maxima. United States National Oceanic and Atmospheric Administration's National Weather Service. [June 4, 2012].
- ^ 31.0 31.1 31.2 31.3 31.4 31.5 31.6 引证错误:没有为名为
Florida Rain的参考文献提供内容 - ^ Barnes, Jay. Florida's Hurricane History
 . University of North Carolina Press: Chapel Hill. 2007: 25. ISBN 978-0-8078-3068-0.
- ^ 33.0 33.1 Roth, David M; Hydrometeorological Prediction Center. Tropical Storm Alberto Rainfall Page. Tropical Cyclone Point Maxima. United States National Oceanic and Atmospheric Administration's National Weather Service. [June 5, 2012].
- ^ 34.0 34.1 34.2 34.3 34.4 Haggard, William H; Bilton, Thaddeus H; Crutcher, Harold L. Maximum Rainfall from Tropical Cyclone Systems which Cross the Appalachians (PDF). Journal of Applied Meteorology. 1973, 12 (1): 50–61 [July 16, 2007]. Bibcode:1973JApMe..12...50H. doi:10.1175/1520-0450(1973)012<0050:MRFTCS>2.0.CO;2.
- ^ 35.00 35.01 35.02 35.03 35.04 35.05 35.06 35.07 35.08 35.09 35.10 35.11 35.12 35.13 引证错误:没有为名为
WPCSE的参考文献提供内容 - ^ 36.0 36.1 36.2 36.3 Stacy R. Stewart. Hurricane Matthew (AL142016) (PDF) (报告). Tropical Cyclone Report. National Hurricane Center. April 3, 2017 [April 6, 2017].
- ^ Guam Catastrophe Model. Risk Management Solutions. [June 16, 2007]. 原始内容存档于February 7, 2011.
- ^ Winds. PacificWorlds.com. [June 16, 2007]. (原始内容存档于August 27, 2007).
- ^ 39.0 39.1 Roth, David M; Hydrometeorological Prediction Center. Hurricane Audrey rainfall page. Tropical Cyclone Point Maxima. April 22, 2010 [April 24, 2010].
- ^ 40.0 40.1 40.2 Storm Summary Number 15 for Heavy Rain Associated with Alberto. National Oceanic and Atmospheric Administration. Weather Prediction Center. May 31, 2018 [September 26, 2018].
- ^ Post-Tropical Cyclone Bill Advisory Number 22. National Oceanic and Atmospheric Administration. Weather Prediction Center. June 21, 2015 [December 6, 2015].
- ^ Thunderstorms hit northern plains. The Chronicle Telegram. 1979 [October 1, 2007].[永久失效連結]
- ^ 43.00 43.01 43.02 43.03 43.04 43.05 43.06 43.07 43.08 43.09 43.10 43.11 43.12 43.13 43.14 43.15 43.16 43.17 43.18 43.19 43.20 43.21 43.22 43.23 43.24 43.25 43.26 43.27 43.28 43.29 43.30 43.31 43.32 43.33 43.34 43.35 43.36 43.37 43.38 43.39 43.40 43.41 43.42 43.43 43.44 43.45 43.46 43.47 43.48 43.49 43.50 43.51 43.52 43.53 43.54 43.55 43.56 43.57 43.58 43.59 43.60 43.61 43.62 43.63 43.64 43.65 43.66 43.67 43.68 43.69 43.70 43.71 43.72 43.73 43.74 43.75 43.76 43.77 43.78 43.79 43.80 43.81 43.82 43.83 43.84 43.85 43.86 Roth, David M; Hydrometeorological Prediction Center. Tropical Cyclone Rainfall for the Midwest states. United States National Oceanic and Atmospheric Administration's National Weather Service. 2012 [May 13, 2012].
- ^ 44.0 44.1 44.2 44.3 Brendon Jarrod Rubin-Oster. Post-Tropical Cyclone Bill Advisory Number 22. Weather Prediction Center (报告) (College Park, Maryland: National Oceanic and Atmospheric Administration). June 21, 2015 [June 21, 2015].
- ^ Krekeler. Tropical Depression CINDY Advisory Number 19 (报告). Weather Prediction Center. June 23, 2017 [August 27, 2017].
- ^ Roth, David M; Hydrometeorological Prediction Center. Unnamed Tropical Storm — June 22–29, 1960. Tropical Cyclone Point Maxima. United States National Oceanic and Atmospheric Administration's National Weather Service. [June 13, 2012].
- ^ 47.0 47.1 47.2 引证错误:没有为名为
statemaxima的参考文献提供内容 - ^ Roth, David M; Hydrometeorological Prediction Center. A Brief Climatology of Tropical Cyclones in Louisiana (PDF). United States National Oceanic and Atmospheric Administration's National Weather Service. [June 5, 2012]. (原始内容存档于June 5, 2012).
- ^ Lamers. Post-Tropical Cyclone Barry Advisory Number 25 (报告). Weather Prediction Center. July 16, 2019 [July 16, 2019].
- ^ Sable, Edward Sable; United States Weather Bureau. Hurricane Daisy effects on New England (United States Government Memorandum). United States National Oceanic and Atmospheric Administration's National Weather Service. November 23, 1962 [June 5, 2012].
- ^ Dunn, Gordan E and staff. The hurricane season of 1962 (PDF). Monthly Weather Review (American Meteorological Society). 1963, 91 (4): 199–207 [June 5, 2012]. Bibcode:1963MWRv...91..199D. doi:10.1175/1520-0493-91.4.199.
- ^ Bryant, Ann. Carrabassett Valley deals with aftermath of Hurricane Irene. Sun Journal. August 30, 2011 [November 1, 2011].
- ^ Public Information Statement: Spotter Reports. National Weather Service Office in Caribou, Maine. National Oceanic and Atmospheric Administration. July 6, 2014 [July 6, 2014]. (原始内容存档于July 6, 2014).
- ^ 54.0 54.1 Roth, David M; Hydrometeorological Prediction Center. Hurricane Eloise (1975) Rainfall Graphic (GIF). Tropical Cyclone Point Maxima. United States National Oceanic and Atmospheric Administration's National Weather Service. [June 4, 2012].
- ^ 55.0 55.1 55.2 55.3 Brown, Daniel P; National Hurricane Center. Tropical Storm Lee (PDF) (Tropical Cyclone Report). United States National Oceanic and Atmospheric Administration's National Weather Service: 20–25. December 15, 2011 [June 1, 2012].
- ^ Roth, David M. Hurricane Georges Rainfall Page. Tropical Cyclone Point Maxima. [June 4, 2012].
- ^ Guiney, John L; National Hurricane Center. Hurricane Georges 1998. United States National Oceanic and Atmospheric Administration's National Weather Service. January 5, 1999 [June 3, 2012]. (原始内容 (Preliminary Report)存档于October 5, 2009).
- ^ Krekeler. Tropical Depression CINDY Advisory Number 15 (报告). Weather Prediction Center. June 23, 2017 [June 23, 2017].
- ^ 59.0 59.1 David M. Roth. Tropical Storm Erin Rainfall Page. [March 6, 2008].
- ^ 60.0 60.1 60.2 Roth, David M; Hydrometeorological Prediction Center. Hurricane Floyd — September 14–17, 1999. United States National Oceanic and Atmospheric Administration's National Weather Service. [March 6, 2008].
- ^ 61.0 61.1 Gerhardt; Hydrometeorological Prediction Center. Remnants of Sandy Public Advisory Thirty-Seven (Final). United States National Oceanic and Atmospheric Administration's National Weather Service. October 31, 2012 [March 17, 2013].
- ^ http://www.nhc.noaa.gov/text/refresh/MIAWPCEP5+shtml/080826.shtml
- ^ Cangialosi, John P. Tropical Cyclone Report: Tropical Depression Sixteen-E September 20–21, 2015 (PDF) (报告). United States National Hurricane Center. January 11, 2016.
- ^ Knight, David B; Davis, Robert E. Climatology of Tropical Cyclone Rainfall in the Southeastern United States. Physical Geography. 2007, 28 (2): 126–147 [June 5, 2012]. doi:10.2747/0272-3646.28.2.126. (原始内容存档于July 9, 2012).
- ^ 引证错误:没有为名为
champi的参考文献提供内容 - ^ Daily Weather Maps: September 10–16, 1979. National Weather Service. [March 6, 2008].
- ^ 67.0 67.1 Roth, David M; Hydrometeorological Prediction Center. Hurricane Ignacio Rainfall Page. Tropical Cyclone Point Maxima. United States National Oceanic and Atmospheric Administration's National Weather Service. [June 4, 2012].
- ^ Roth, David M; Hydrometeorological Prediction Center. Hurricane Georges. Tropical Cyclone Point Maxima. United States National Oceanic and Atmospheric Administration's National Weather Service. [June 6, 2012].
- ^ Roth, David M; Hydrometeorological Prediction Center. Tropical Storm Isabel. Tropical Cyclone Point Maxima. United States National Oceanic and Atmospheric Administration's National Weather Service. [June 6, 2012].
- ^ [Elizabethtown Hurricane Florence 2018 rainfall graphic] 请检查
|url=值 (帮助). National Oceanic and Atmospheric Administration. Weather Prediction Center. 2019 [April 12, 2019]. - ^ Richard J. Pasch; Todd B. Kimberlain; Stacy R. Stewart. Preliminary Report: Hurricane Floyd (PDF). National Hurricane Center. November 18, 1999 [March 4, 2019].
- ^ Roth, David M; Hydrometeorological Prediction Center. Tropical Storm Chris rainfall page. Tropical Cyclone Point Maxima. United States National Oceanic and Atmospheric Administration's National Weather Service. [June 7, 2012].
- ^ Roth, David M; Hydrometeorological Prediction Center. A Brief Climatology of Tropical Cyclones in Texas. Texas Hurricane History (PDF) (报告). United States National Oceanic and Atmospheric Administration's National Weather Service. [June 6, 2012]. (原始内容存档 (PDF)于June 6, 2012).
- ^ 74.0 74.1 Lixion Avila. Tropical Storm Harvey Advisory Number 38 (报告). Miami, Florida: National Hurricane Center. August 29, 2017 [August 29, 2017].
- ^ The previous record for total rainfall during a tropical cyclone has been broken. National Weather Service Houston/Galveston TX. [August 29, 2017].
- ^ 76.0 76.1 Roth, David M; Hydrometeorological Prediction Center. Tropical Storm Claudette. Tropical Cyclone Point Maxima. United States National Oceanic and Atmospheric Administration's National Weather Service. [June 4, 2012].
- ^ Billion-Dollar Weather and Climate Disasters: Table of Events. U.S. Billion-Dollar Weather and Climate Disasters. Asheville, North Carolina: National Centers for Environmental Information. September 2019.
- ^ 78.0 78.1 Roth, David M; Hydrometeorological Prediction Center. Hurricane Hortense. Tropical Cyclone Point Maxima. United States National Oceanic and Atmospheric Administration's National Weather Service. [June 4, 2012].
- ^ Roth, David M; Hydrometeorological Prediction Center. Hurricane David 1979 Rainfall Graphic for Puerto Rico. Tropical Cyclone Point Maxima. United States National Oceanic and Atmospheric Administration's National Weather Service. [June 4, 2012].
- ^ Roth, David M; Hydrometeorological Prediction Center. Precursor to Hurricane Kendra 1978 Rainfall Graphic. Tropical Cyclone Point Maxima. United States National Oceanic and Atmospheric Administration's National Weather Service. [June 4, 2012].
- ^ Roth, David M; Hydrometeorological Prediction Center. Hurricane Carmen 1974 Rainfall Graphic for Puerto Rico. Tropical Cyclone Point Maxima. United States National Oceanic and Atmospheric Administration's National Weather Service. [June 4, 2012].
- ^ Roth, David M; Cobb, Hugh. Virginia Tropical Cyclone Climatology. Virginia Hurricane History. United States National Oceanic and Atmospheric Administration's National Weather Service. [June 6, 2012].