File:LogisticMap BifurcationDiagram.png

預覽大小:800 × 566 像素。 其他解析度:320 × 226 像素 | 640 × 453 像素 | 1,024 × 724 像素 | 1,280 × 905 像素 | 1,838 × 1,300 像素。
原始檔案 (1,838 × 1,300 像素,檔案大小:571 KB,MIME 類型:image/png)
摘要
| 描述 |
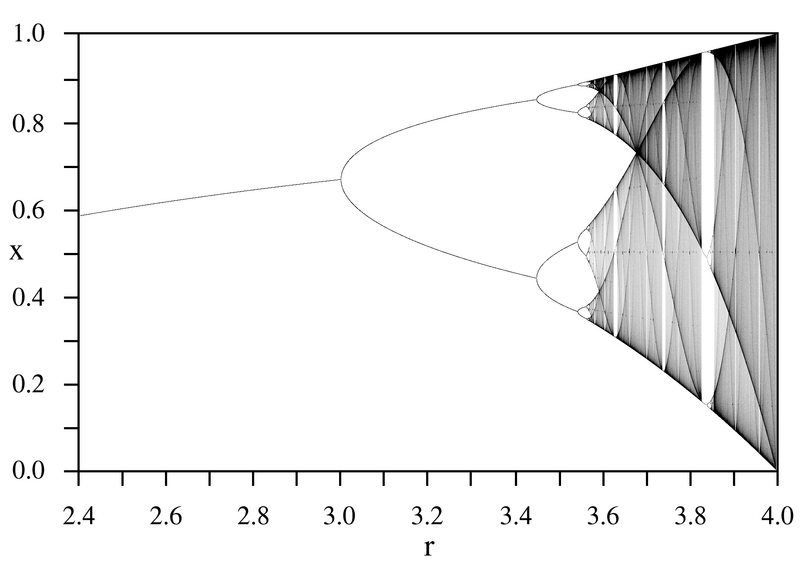
English: A bifurcation diagram for the Logistic map:
|
| 日期 | |
| 來源 | 自己的作品 |
| 作者 | PAR |

授權條款
| 我,此作品的版權所有人,釋出此作品至公共領域。此授權條款在全世界均適用。 這可能在某些國家不合法,如果是的話: 我授予任何人有權利使用此作品於任何用途,除受法律約束外,不受任何限制。 |

|
本圖片是以PNG、GIF或JPEG格式上傳。然而,其中包含的資料或訊息,應該重新建立成可縮放向量圖形(SVG)檔案,以更有效率或更準確的方式儲存。如有可能,請上傳本圖片的SVG格式版本。在上傳之後,請修改維基各姊妹計畫中所有使用舊版圖片的條目(列在圖像連結章節中),替換為新版圖片,並在舊圖片的描述頁中加入{{Vector version available|新圖片名稱.svg}}模板,同時移除本模板。
|
檔案歷史
點選日期/時間以檢視該時間的檔案版本。
| 日期/時間 | 縮圖 | 尺寸 | 使用者 | 備註 | |
|---|---|---|---|---|---|
| 目前 | 2005年9月14日 (三) 00:11 | | 1,838 × 1,300(571 KB) | PAR~commonswiki | Bifurcation diagram for the logistic map for parameter r=2.4 to 4.0. |
檔案用途
下列5個頁面有用到此檔案:
全域檔案使用狀況
以下其他 wiki 使用了這個檔案:
- ar.wikipedia.org 的使用狀況
- ca.wikipedia.org 的使用狀況
- da.wikipedia.org 的使用狀況
- de.wikipedia.org 的使用狀況
- el.wikipedia.org 的使用狀況
- en.wikipedia.org 的使用狀況
- Talk:Bifurcation diagram
- Talk:Logistic map
- Mitchell Feigenbaum
- Portal:Mathematics/Featured picture archive
- Recurrence quantification analysis
- Portal:Mathematics/Suggestions
- Wikipedia:WikiProject Systems/List of images of systems
- User:Kiefer.Wolfowitz
- Wikipedia talk:WikiProject Mathematics/Archive/2011
- Ivar Ekeland
- Wikipedia talk:WikiProject Mathematics/Archive/2011/Apr
- User talk:Kiefer.Wolfowitz/Archive 9
- Portal:Mathematics/Featured picture/2011 12
- User:RazrRekr201/Table of constants
- Mathematical constant
- en.wikibooks.org 的使用狀況
- en.wikiversity.org 的使用狀況
- eo.wikipedia.org 的使用狀況
- es.wikipedia.org 的使用狀況
- fi.wikipedia.org 的使用狀況
- fr.wikipedia.org 的使用狀況
- fr.wikiversity.org 的使用狀況
- he.wikipedia.org 的使用狀況
檢視此檔案的更多全域使用狀況。