File:Beta distribution pdf.svg

原始檔案(SVG 檔案,表面大小:531 × 425 像素,檔案大小:80 KB)


摘要

描述
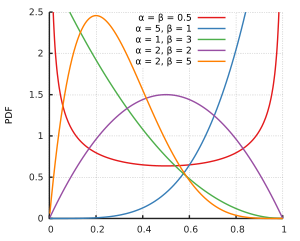
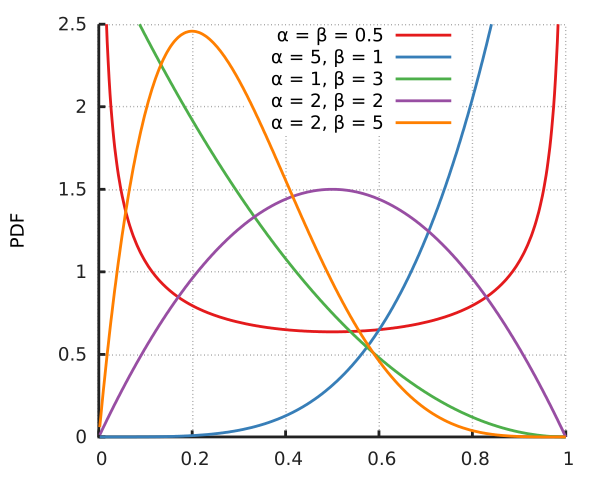
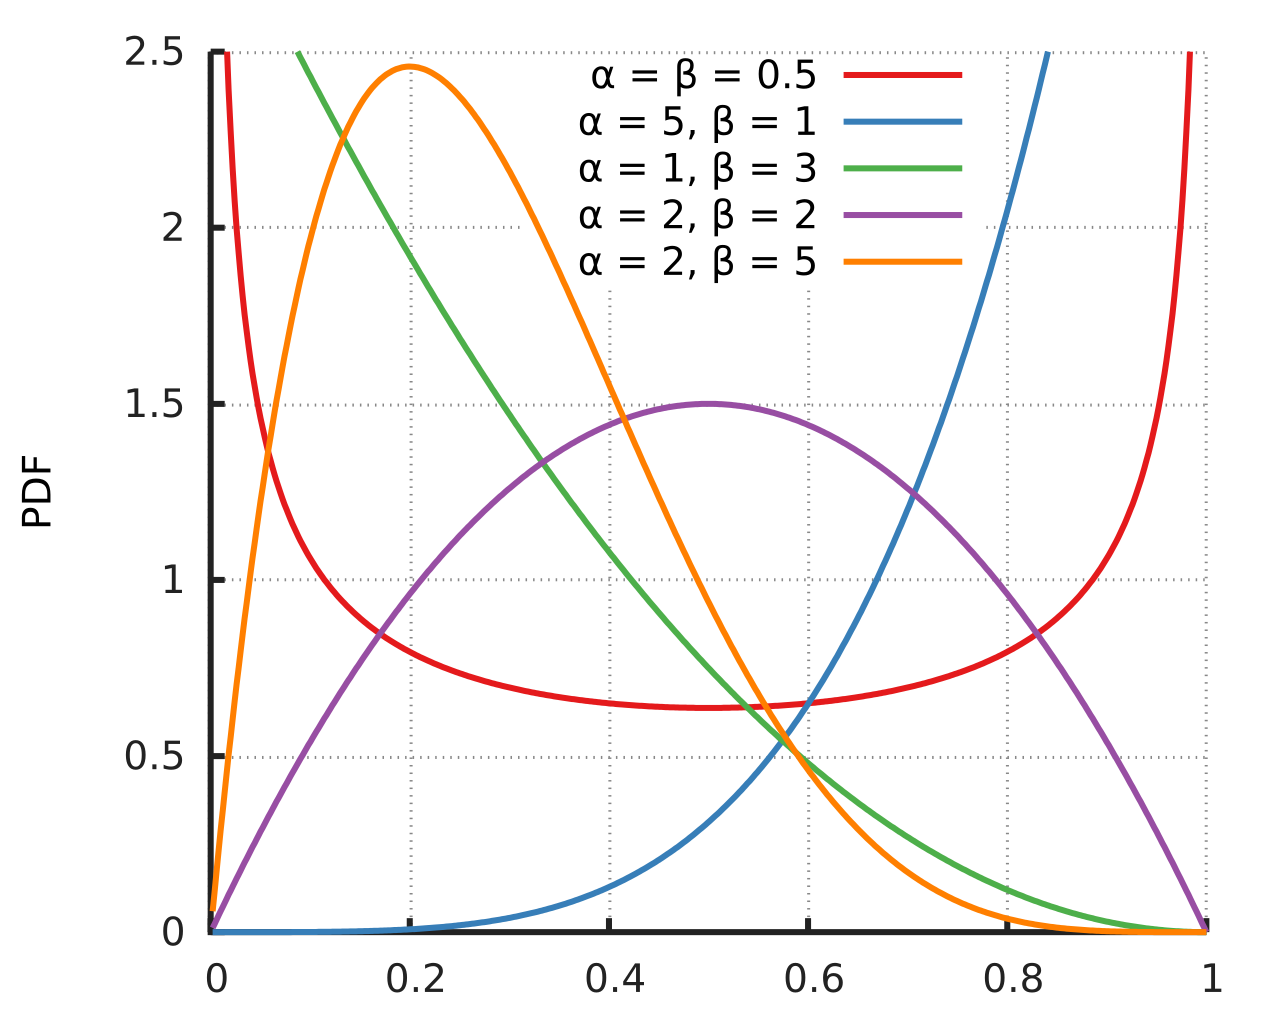
English: Probability density function for the Beta distribution. Created using Gnuplot.
日期
來源 自己的作品
作者 Horas based on the work of Krishnavedala
其他版本 File:Beta_distribution_pdf.png
SVG開發
InfoField
 
SVG檔案的原始碼通過W3C驗證
 
向量圖形使用Gnuplot創作。
 
The file size of this SVG plot may be irrationally large because its text has been converted to paths inhibiting translations.
原始碼
InfoField

Gnuplot code

Source code
reset
reset session

out=2
outputpath= "./"
outputfilename="betadistribution"
if(out==1) {
	set terminal qt size 1000,750 font ",14"
}
if(out==2) {
	set terminal pdfcairo size 15cm,12cm  font ",20" linewidth 2
	set output outputpath.outputfilename.".pdf"
}
if(out==3) {
	set terminal pngcairo size 800,600  font ",14"
	set output  outputpath.outputfilename.".png"
}

dbeta(x,a,b) = exp((a-1)*log(x)+(b-1)*log(1-x)-lgamma(a)-lgamma(b)+lgamma(a+b))
pbeta(x,a,b) = ibeta(a,b,x)
f(x,y,z) = dbeta(x,y,z)

set samples 500
 
set xrange [0:1]
set xtics 0.2
set yrange [0:2.5]
set ytics 0.5

#set xlabel "x"
set ylabel "PDF"

set key at .78,2.5

set grid xtics ytics mytics lw 1 lc rgb "#888888" dashtype 3 lt 1
set border 3 back lw 2 lc rgb "#222222"
set tics in nomirror scale 0.75

lww=2
set ls 1 lw lww lc rgb "#e41a1c"
set ls 2 lw lww lc rgb "#377eb8"
set ls 3 lw lww lc rgb "#4daf4a"
set ls 4 lw lww lc rgb "#984ea3"
set ls 5 lw lww lc rgb "#ff7f00"

plot \
    f(x, 0.5,0.5) w l ls 1	title "{/Symbol a} = {/Symbol b} = 0.5", \
    f(x, 5,  1)   w l ls 2	title "{/Symbol a} = 5, {/Symbol b} = 1", \
    f(x, 1,  3)   w l ls 3	title "{/Symbol a} = 1, {/Symbol b} = 3", \
    f(x, 2,  2)   w l ls 4	title "{/Symbol a} = 2, {/Symbol b} = 2", \
    f(x, 2,  5)   w l ls 5	title "{/Symbol a} = 2, {/Symbol b} = 5"

if (out>1) {
	set output
}
if (out == 1) {
	pause -1

Data

Source code
from matplotlib.pyplot import *
from numpy import linspace
from scipy.stats import beta

x = linspace(0,1,75)

fig = figure()
ax = fig.add_subplot(111)
ax.plot(x,beta.pdf(x,0.5,0.5),label=r"$\alpha=\beta=0.5$")
ax.plot(x,beta.pdf(x,5,1),label=r"$\alpha=5, \beta=1$")
ax.plot(x,beta.pdf(x,1,3),label=r"$\alpha=1, \beta=3$")
ax.plot(x,beta.pdf(x,2,2),label=r"$\alpha=2, \beta=2$")
ax.plot(x,beta.pdf(x,2,5),label=r"$\alpha=2, \beta=5$")
ax.grid(True)
ax.minorticks_on()
ax.legend(loc=9)
setp(ax.get_legend().get_texts(),fontsize='small')
ax.set_ylim(0,2.6)
ax.set_xlabel("x")
ax.set_ylabel("PDF")

fig.savefig("Beta_distribution_pdf.svg",bbox_inches="tight",\
	pad_inches=.15)

授權條款

此檔案不具有著作權,屬於公有領域,因為其所包含之内容均為公共財產且沒有明確的原始作者資訊。

說明

添加單行說明來描述出檔案所代表的內容

在此檔案描寫的項目

描繪內容

創作作者 Chinese (Hong Kong) (已轉換拼寫)

沒有維基數據項目的某些值

作者姓名字串 繁體中文 (已轉換拼寫):​Horas
維基媒體使用者名稱 繁體中文 (已轉換拼寫):​Horas

檔案來源 Chinese (Taiwan) (已轉換拼寫)

上傳者的原創作品 繁體中文 (已轉換拼寫)

多媒體型式 繁體中文 (已轉換拼寫)

image/svg+xml

校驗和 繁體中文 (已轉換拼寫)

de326fe46a16d6d3650e15c3fcb708853472be46

斷定方法:​SHA-1 中文 (已轉換拼寫)

資料大小 Chinese (Hong Kong) (已轉換拼寫)

81,527 位元組

425 像素

531 像素

檔案歷史

點選日期/時間以檢視該時間的檔案版本。

日期/時間縮⁠圖尺寸用戶備⁠註
目前2014年11月14日 (五) 13:10於 2014年11月14日 (五) 13:10 版本的縮圖531 × 425(80 KB)Horas{{Information |Description={{en|1=Probability density function for the Beta distribution. Created using the following code: reset reset session out=2 outputpath= "./" outputfilename="betadistribution" if(out==1) {...
2011年6月4日 (六) 21:45於 2011年6月4日 (六) 21:45 版本的縮圖639 × 489(68 KB)Krishnavedala{{Information |Description ={{en|1=Probability density function for the Beta distribution. Created using python with matplotlib, scipy and numpy toolboxes. <syntaxhighlight lang="

下列頁面有用到此檔案:

全域檔案使用狀況

以下其他 wiki 使用了這個檔案:

詮釋資料